library(ggalign)
#> Loading required package: ggplot2
#> ========================================
#> ggalign version 1.2.0.9000
#>
#> If you use it in published research, please cite:
#> Peng, Y.; Jiang, S.; Song, Y.; et al. ggalign: Bridging the Grammar of Graphics and Biological Multilayered Complexity. Advanced Science. 2025. doi:10.1002/advs.202507799
#> ========================================
geom_magick()
Using images as points in ggplot2
geom_magick() Reads an image with magick, applies optional processing, and uses the result as the graphical shape for points in a plot.
This is useful when you want to replace the usual point symbols with arbitrary images while keeping full control over their placement, size, and interpolation.
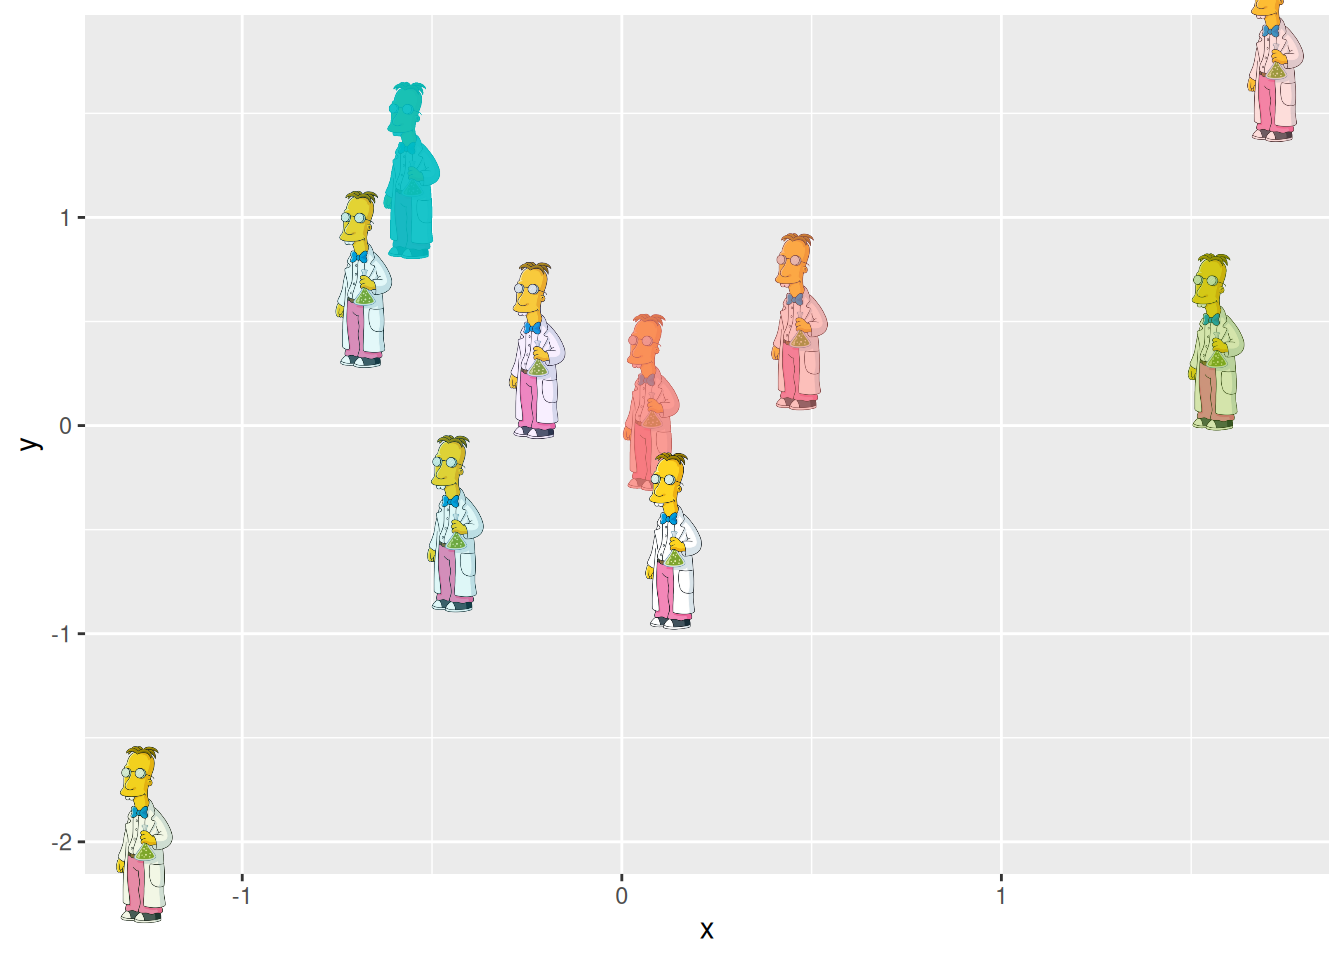
You can combine the image with a fill color and transparency mapping. The fill is applied on top of the image, allowing for color-coded categories without losing the image shape. The size aesthetic controls the image width in "mm".
ggplot(d, aes(x, y)) +
    geom_magick(
        aes(image = image, fill = fill, alpha = alpha),
        size = 12, show.legend = FALSE
    ) +
    coord_cartesian(clip = "off")