library(ggalign)
#> Loading required package: ggplot2
#> ========================================
#> ggalign version 1.2.0.9000
#>
#> If you use it in published research, please cite:
#> Peng, Y.; Jiang, S.; Song, Y.; et al. ggalign: Bridging the Grammar of Graphics and Biological Multilayered Complexity. Advanced Science. 2025. doi:10.1002/advs.202507799
#> ========================================ggheatmap()
Heatmap with different shapes
Basic Heatmap with Pie Chart
Create a heatmap where each cell is represented by a pie chart, with slice angles proportional to the values:
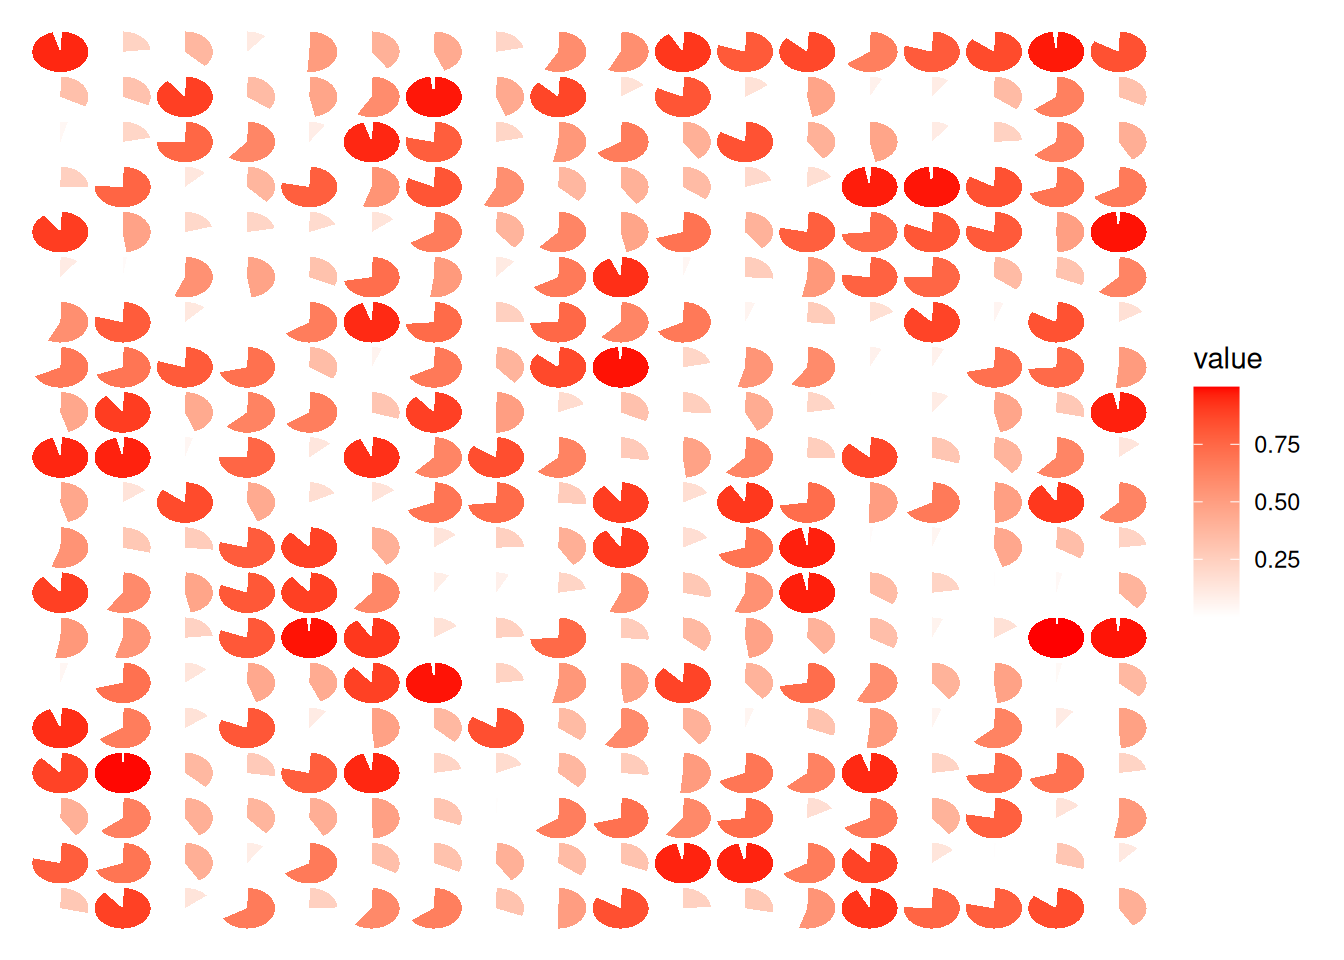
For more complex customizations of pie charts, you can try using ggforce::geom_arc_bar() instead.
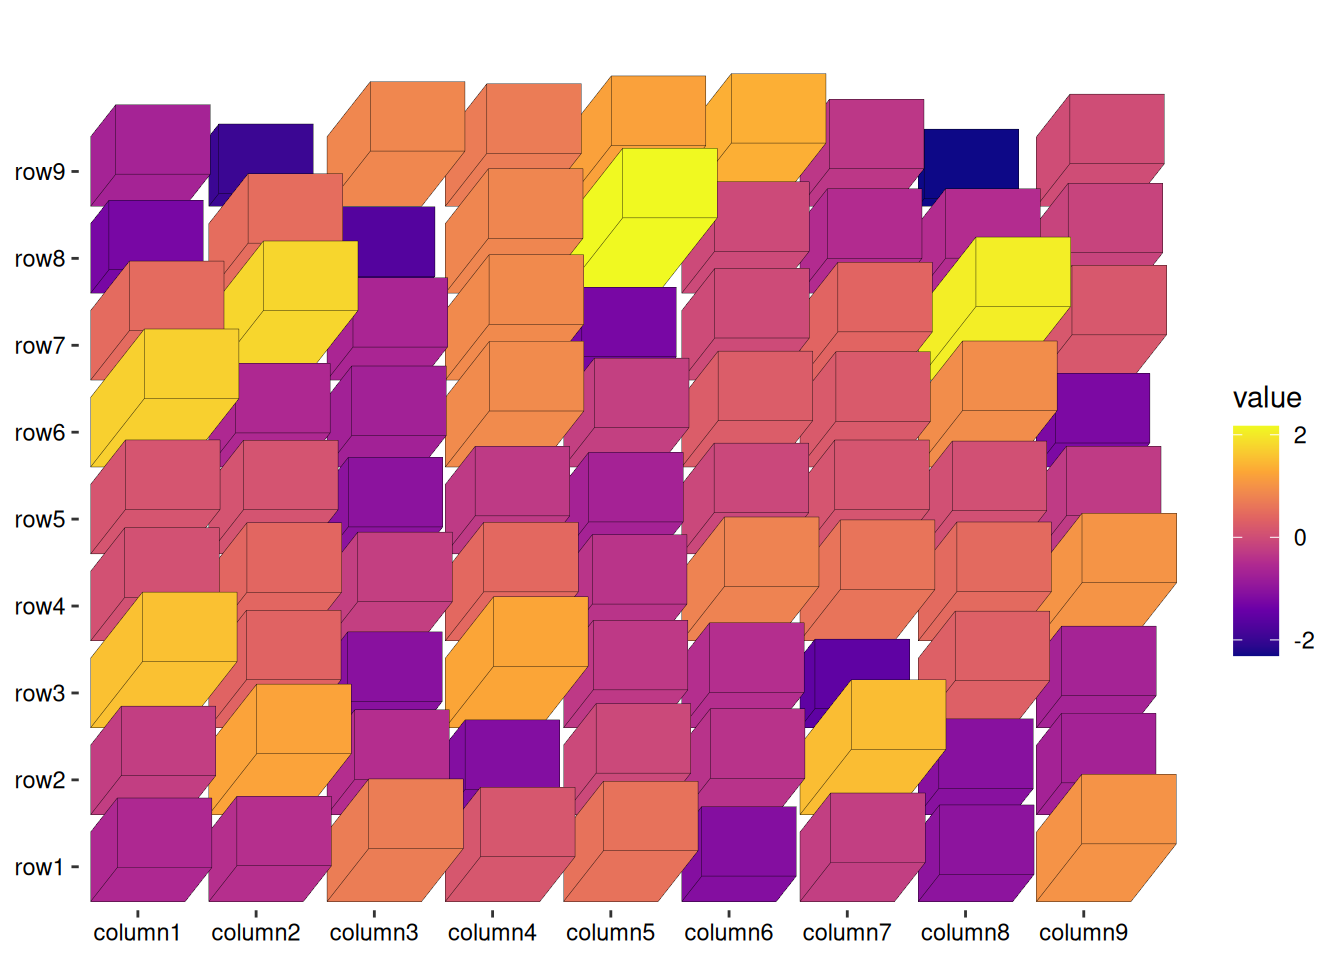
3D Heatmap
Visualize a smaller heatmap matrix using 3D tiles where height and fill color represent values:
set.seed(123)
small_mat <- matrix(rnorm(81), nrow = 9)
rownames(small_mat) <- paste0("row", seq_len(nrow(small_mat)))
colnames(small_mat) <- paste0("column", seq_len(ncol(small_mat)))
ggheatmap(small_mat,
    filling = FALSE,
    theme = theme(
        legend.box.spacing = unit(10, "mm"),
        plot.margin = margin(t = 15, unit = "mm")
    )
) +
    geom_tile3d(
        aes(fill = value, z = value, width = 0.8, height = 0.8),
        color = "black"
    ) +
    scale_fill_viridis_c(
        option = "plasma",
        breaks = scales::breaks_pretty(3L)
    ) +
    coord_cartesian(clip = "off")