library(ggalign)
#> Loading required package: ggplot2
#> ========================================
#> ggalign version 1.2.0.9000
#>
#> If you use it in published research, please cite:
#> Peng, Y.; Jiang, S.; Song, Y.; et al. ggalign: Bridging the Grammar of Graphics and Biological Multilayered Complexity. Advanced Science. 2025. doi:10.1002/advs.202507799
#> ========================================ggside()
Marginal Plot
A marginal plot is a visualization that combines a main plot (usually a scatter plot) with additional plots in the margins of the axes. These marginal plots display the distributions of the individual variables, often using histograms, box plots, or other visual representations.
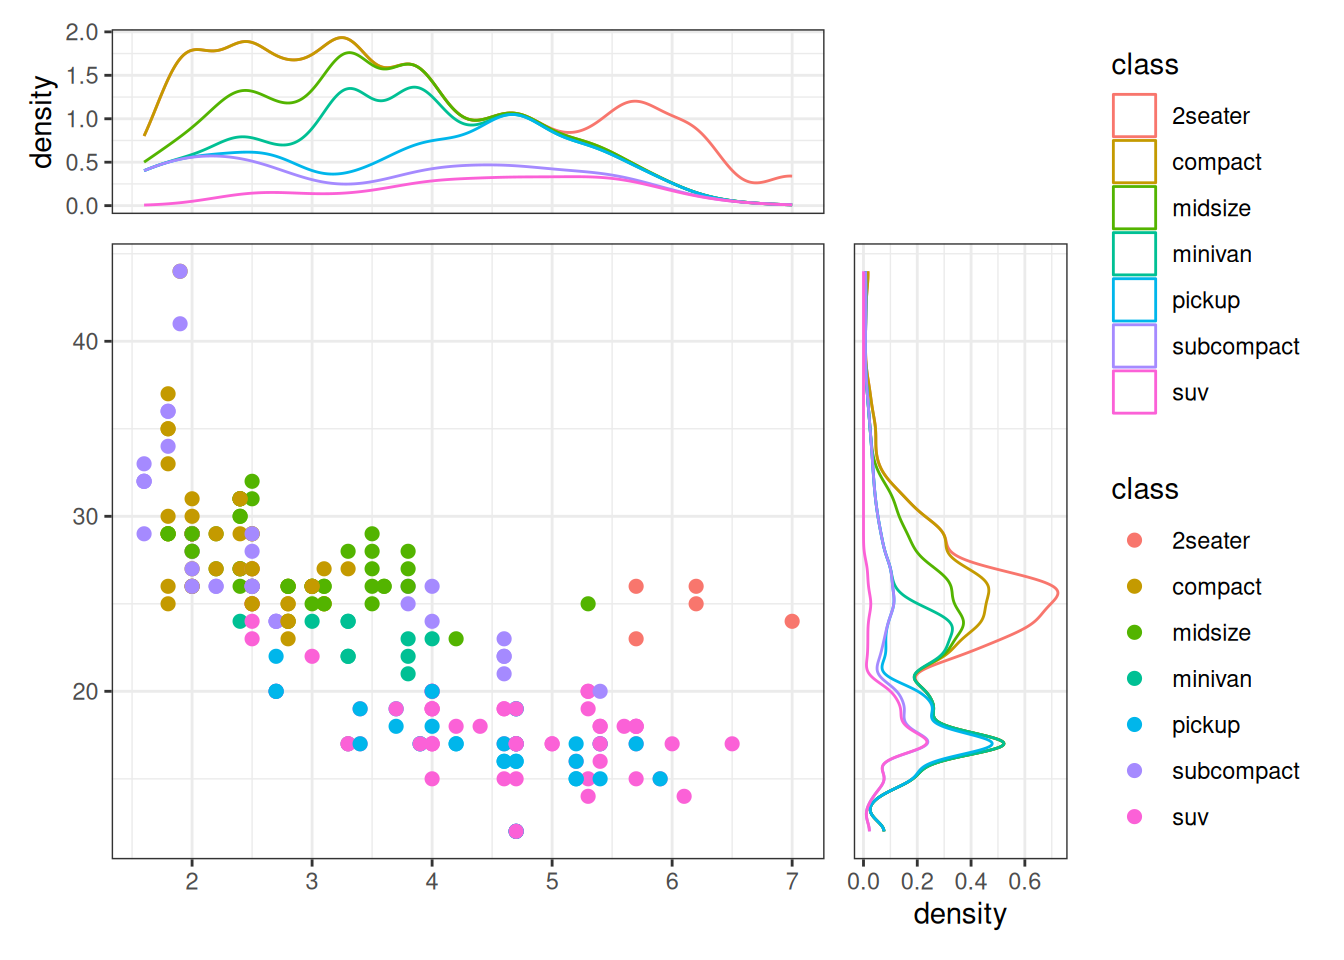
Scatter Plot with Marginal Densities
ggside(mpg, aes(displ, hwy, colour = class)) -
    scheme_theme(theme_bw()) +
    layout_theme(panel.border = element_blank()) +
    geom_point(size = 2) +
    # initialize top annotation
    anno_top(size = 0.3) +
    # add a plot in the top annotation
    ggalign() +
    geom_density(aes(displ, y = after_stat(density), colour = class), position = "stack") +
    # initialize right annotation
    anno_right(size = 0.3) +
    # add a plot in the right annotation
    ggalign() +
    geom_density(aes(x = after_stat(density), hwy, colour = class),
        position = "stack"
    )
Facetted Marginal Plots
i2 <- iris
i2$Group <- rep(c("Group1", "Group2"), 75)
ggside(i2, aes(Sepal.Width, Sepal.Length, color = Species)) +
    geom_point(size = 2) +
    facet_grid(Species ~ Group) +
    theme(
        strip.background = element_blank(),
        strip.text = element_blank()
    ) +
    anno_top(size = 0.3) +
    ggalign() +
    geom_density(aes(Sepal.Width, y = after_stat(density), colour = Species),
        position = "stack"
    ) +
    facet_grid(cols = vars(Group)) +
    theme(
        strip.text = element_text(margin = margin(5, 5, 5, 5)),
        strip.background = element_rect(fill = "grey")
    ) +
    anno_right(size = 0.3) +
    ggalign() +
    geom_density(aes(x = after_stat(density), Sepal.Length, colour = Species),
        position = "stack"
    ) +
    facet_grid(rows = vars(Species)) +
    theme(
        strip.text = element_text(margin = margin(5, 5, 5, 5)),
        strip.background = element_rect(fill = "grey")
    ) -
    quad_scope(scheme_theme(theme_bw()), "tri") &
    scale_color_brewer(palette = "Dark2", guide = "none") &
    scale_x_continuous(breaks = scales::pretty_breaks(3L)) &
    scale_y_continuous(breaks = scales::pretty_breaks(3L)) &
    theme(
        axis.text = element_text(),
        axis.title = element_text(face = "bold")
    )
Reproducing ggpubr Marginal Plot Examples
Reproduce cases in Add marginal plots of ggpubr post.
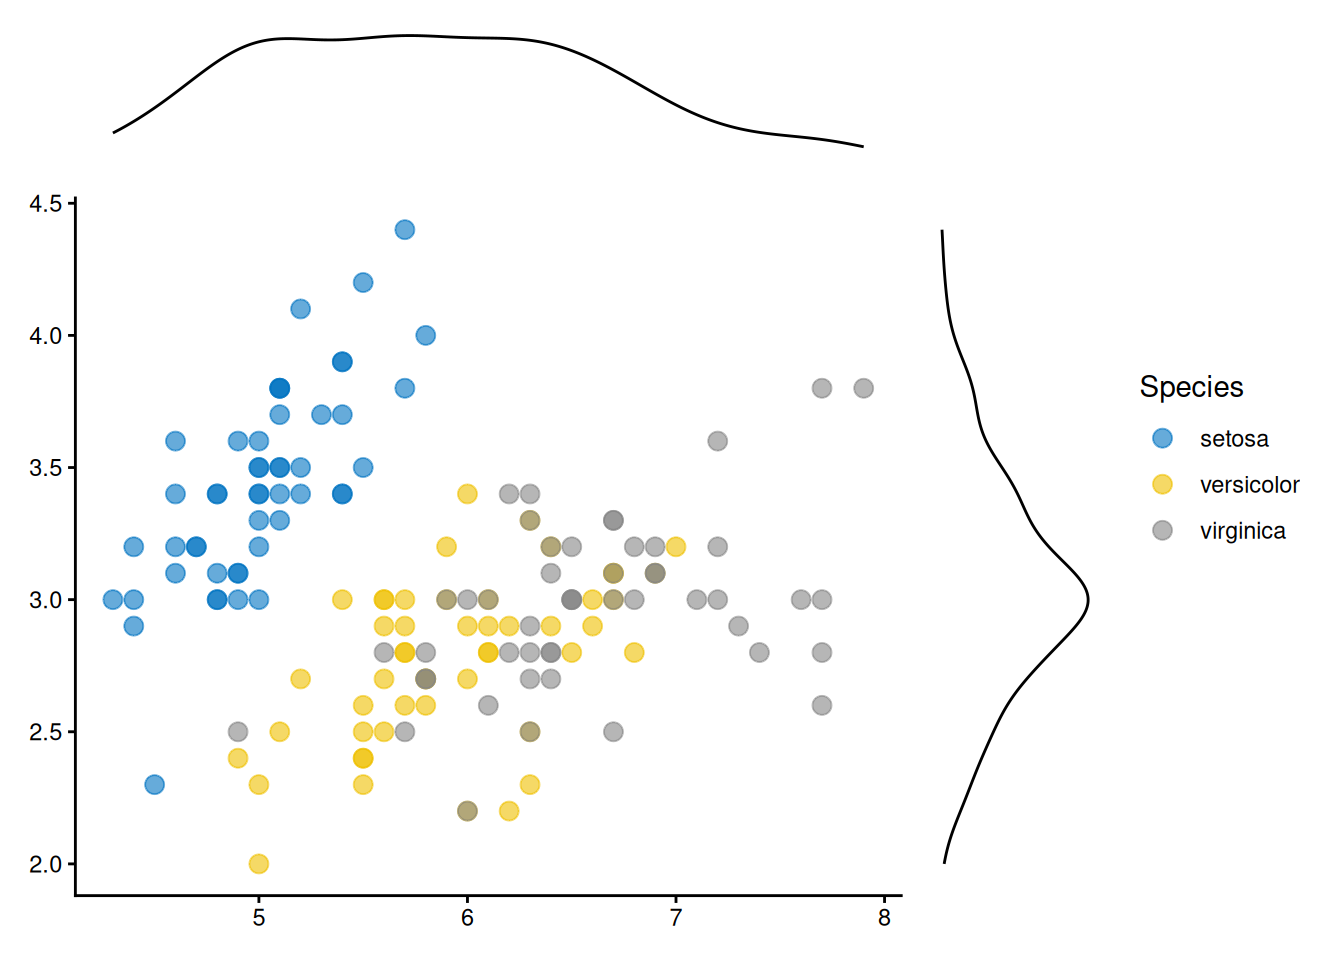
ggside(iris, aes(Sepal.Length, Sepal.Width, colour = Species)) +
    geom_point(size = 3, alpha = 0.6) +
    ggsci::scale_color_jco() +
    theme_classic() +
    anno_top(size = 0.2) +
    ggalign() +
    geom_density(aes(x = Sepal.Length)) +
    theme_no_axes() +
    anno_right(size = 0.2) +
    ggalign() +
    geom_density(aes(y = Sepal.Width)) +
    theme_no_axes()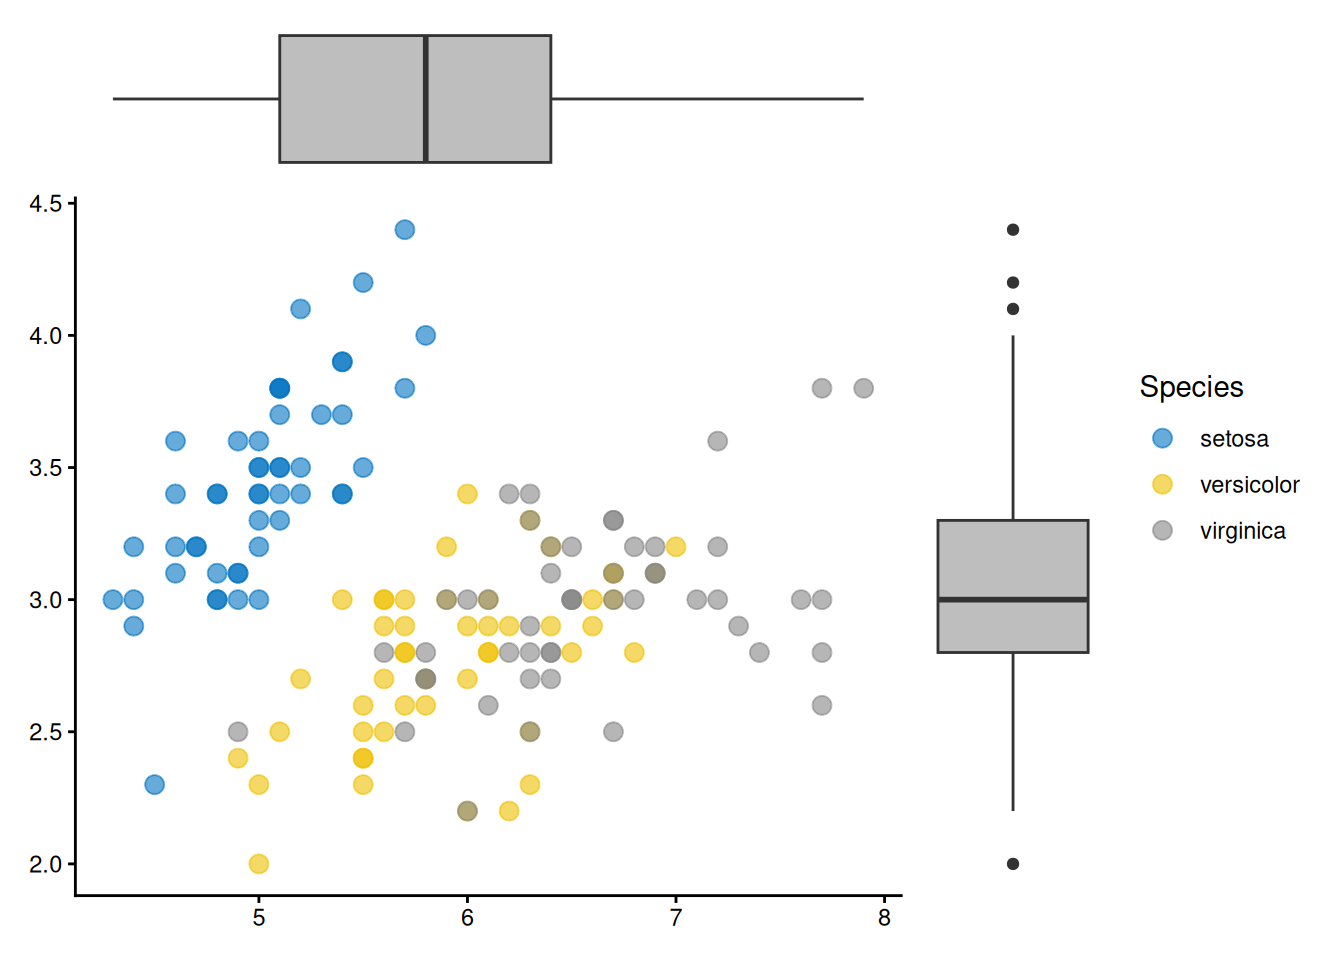
ggside(iris, aes(Sepal.Length, Sepal.Width, colour = Species)) +
    geom_point(size = 3, alpha = 0.6) +
    ggsci::scale_color_jco() +
    theme_classic() +
    anno_top(size = 0.2) +
    ggalign() +
    geom_boxplot(aes(x = Sepal.Length), fill = "grey") +
    theme_no_axes() +
    anno_right(size = 0.2) +
    ggalign() +
    geom_boxplot(aes(y = Sepal.Width), fill = "grey") +
    theme_no_axes()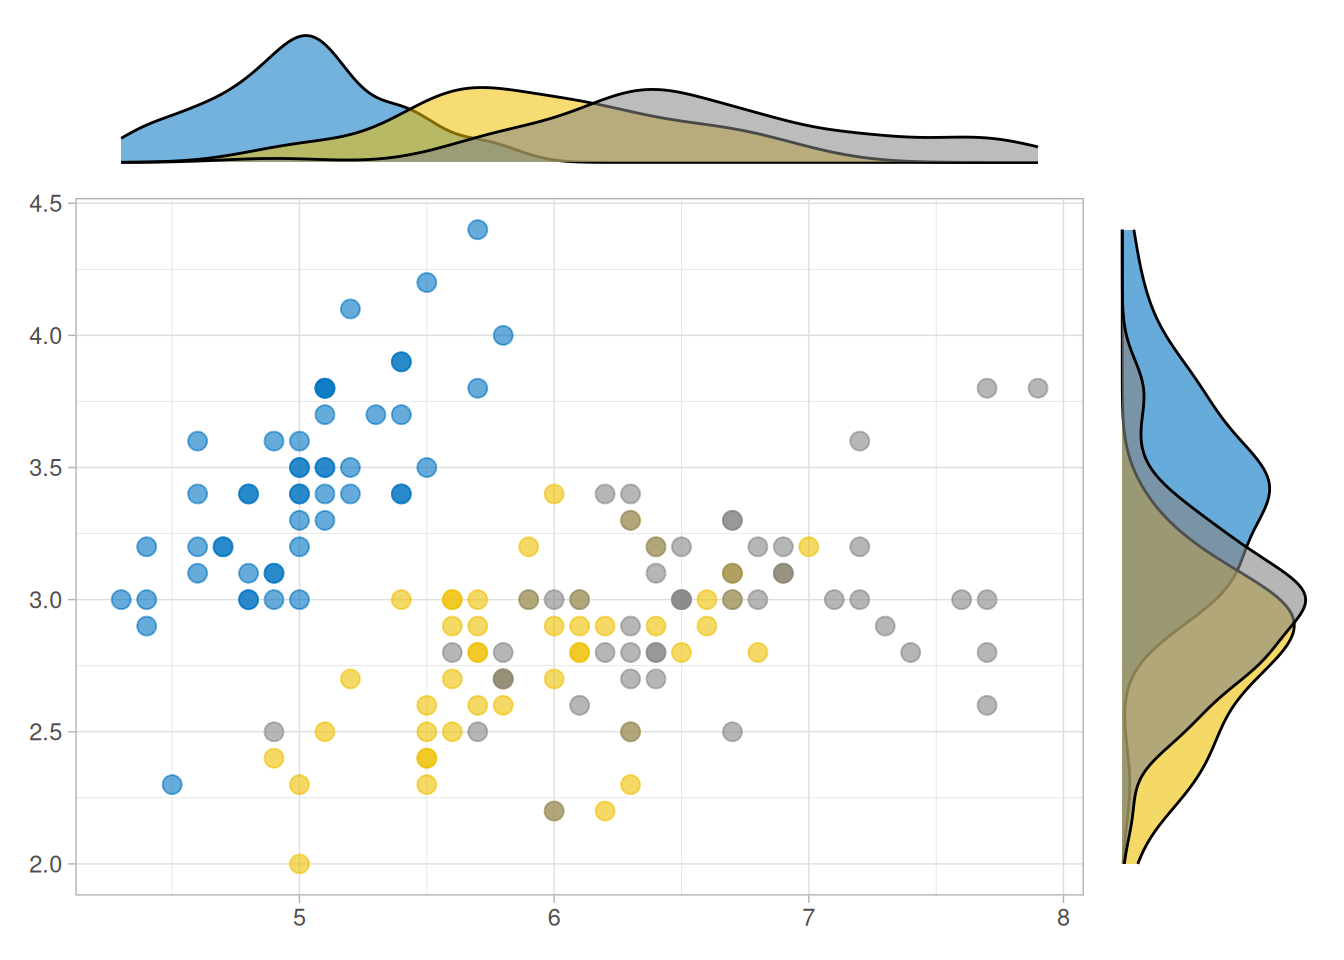
ggside(iris, aes(Sepal.Length, Sepal.Width, colour = Species)) +
    geom_point(size = 3, alpha = 0.6) +
    ggsci::scale_color_jco() +
    theme_light() +
    anno_top(size = 0.2) +
    ggalign() +
    geom_density(aes(x = Sepal.Length, fill = Species, alpha = 0.6)) +
    theme_no_axes() +
    anno_right(size = 0.2) +
    ggalign() +
    geom_density(aes(y = Sepal.Width, fill = Species), alpha = 0.6) +
    theme_no_axes() &
    ggsci::scale_fill_jco() &
    theme(legend.position = "none")
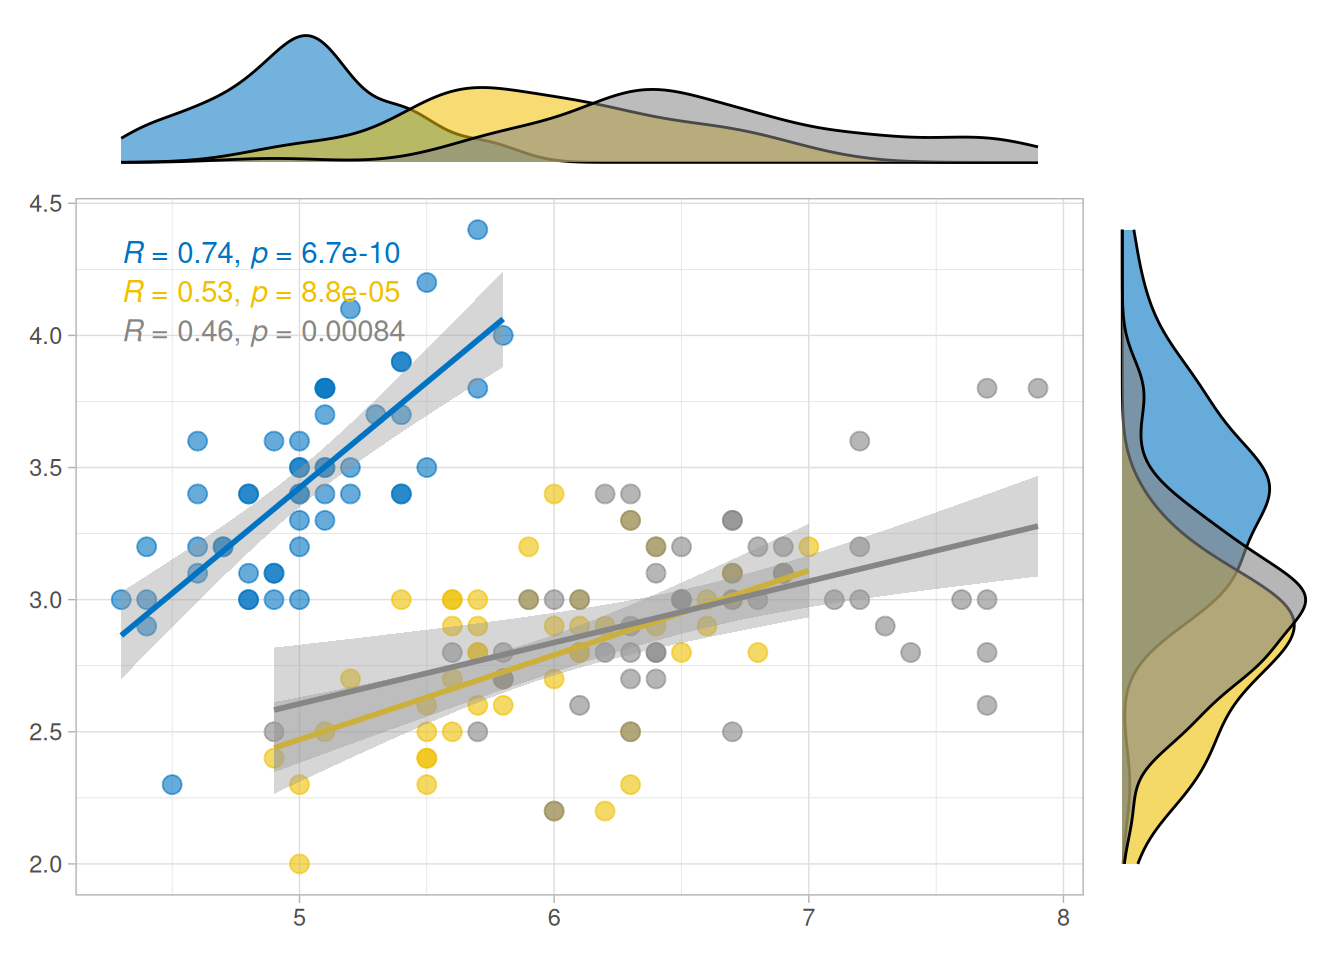
ggside(iris, aes(Sepal.Length, Sepal.Width, colour = Species)) +
    geom_point(size = 3, alpha = 0.6) +
    geom_smooth(method = lm) +
    ggpubr::stat_cor() +
    ggsci::scale_color_jco() +
    theme_light() +
    anno_top(size = 0.2) +
    ggalign() +
    geom_density(aes(x = Sepal.Length, fill = Species, alpha = 0.6)) +
    theme_no_axes() +
    anno_right(size = 0.2) +
    ggalign() +
    geom_density(aes(y = Sepal.Width, fill = Species), alpha = 0.6) +
    theme_no_axes() &
    ggsci::scale_fill_jco() &
    theme(legend.position = "none")
#> `geom_smooth()` using formula = 'y ~ x'