library(ggalign)
#> Loading required package: ggplot2
#> ========================================
#> ggalign version 1.2.0.9000
#>
#> If you use it in published research, please cite:
#> Peng, Y.; Jiang, S.; Song, Y.; et al. ggalign: Bridging the Grammar of Graphics and Biological Multilayered Complexity. Advanced Science. 2025. doi:10.1002/advs.202507799
#> ========================================align_plots()
Plot Composer - Basics
p1 <- ggplot(mtcars) +
    geom_point(aes(mpg, disp)) +
    ggtitle("Plot 1")

p2 <- ggplot(mtcars) +
    geom_boxplot(aes(gear, disp, group = gear)) +
    ggtitle("Plot 2")

p3 <- ggplot(mtcars) +
    geom_point(aes(hp, wt, colour = mpg)) +
    ggtitle("Plot 3")

p4 <- ggplot(mtcars) +
    geom_bar(aes(gear)) +
    facet_wrap(~cyl) +
    ggtitle("Plot 4")
Combine plots directly:
align_plots(p1, p2)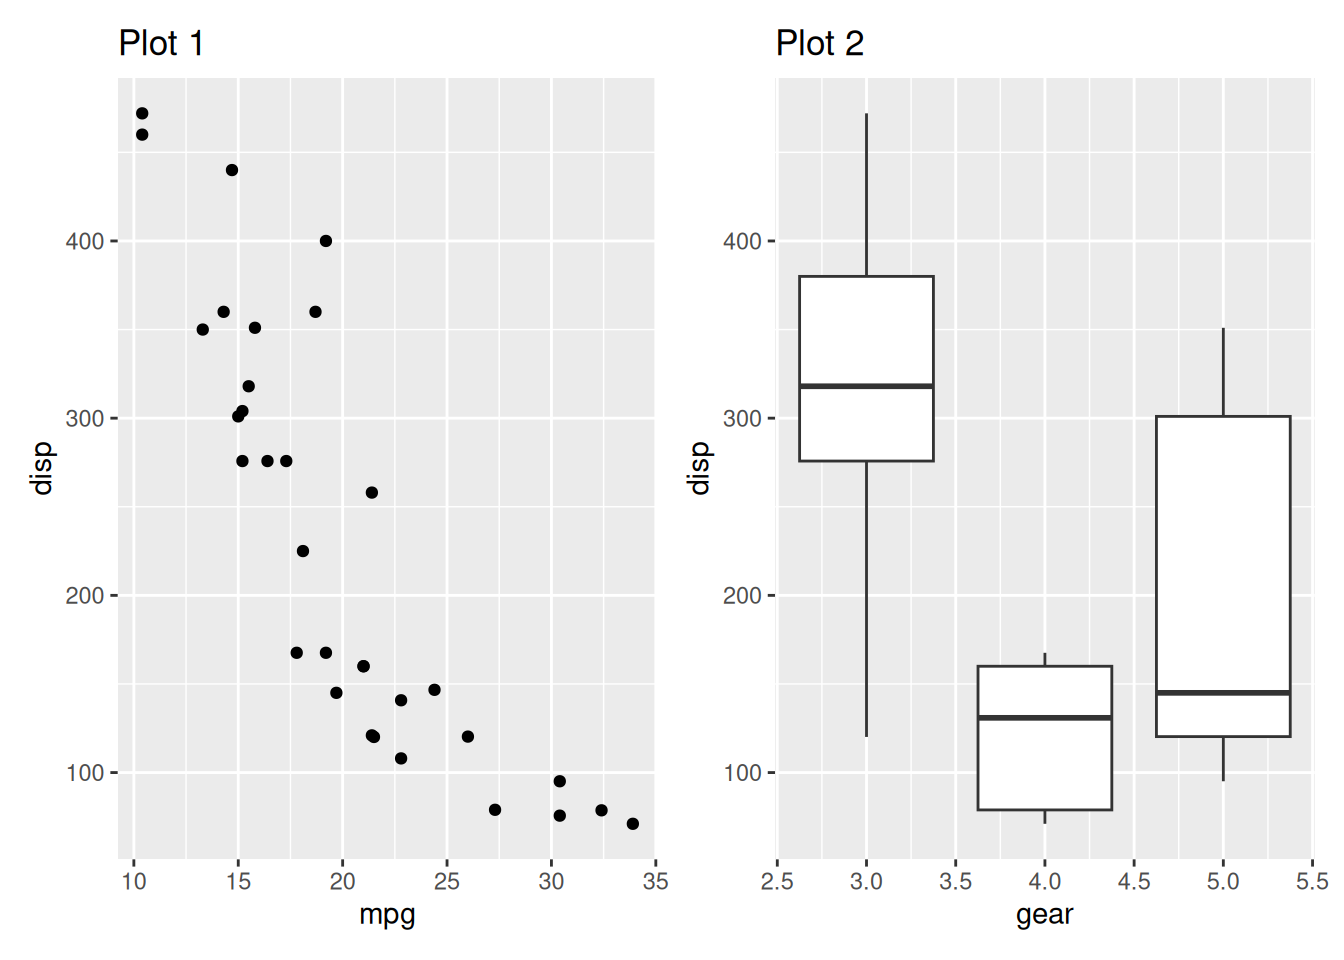
By row:
align_plots(p1, p2, ncol = 1)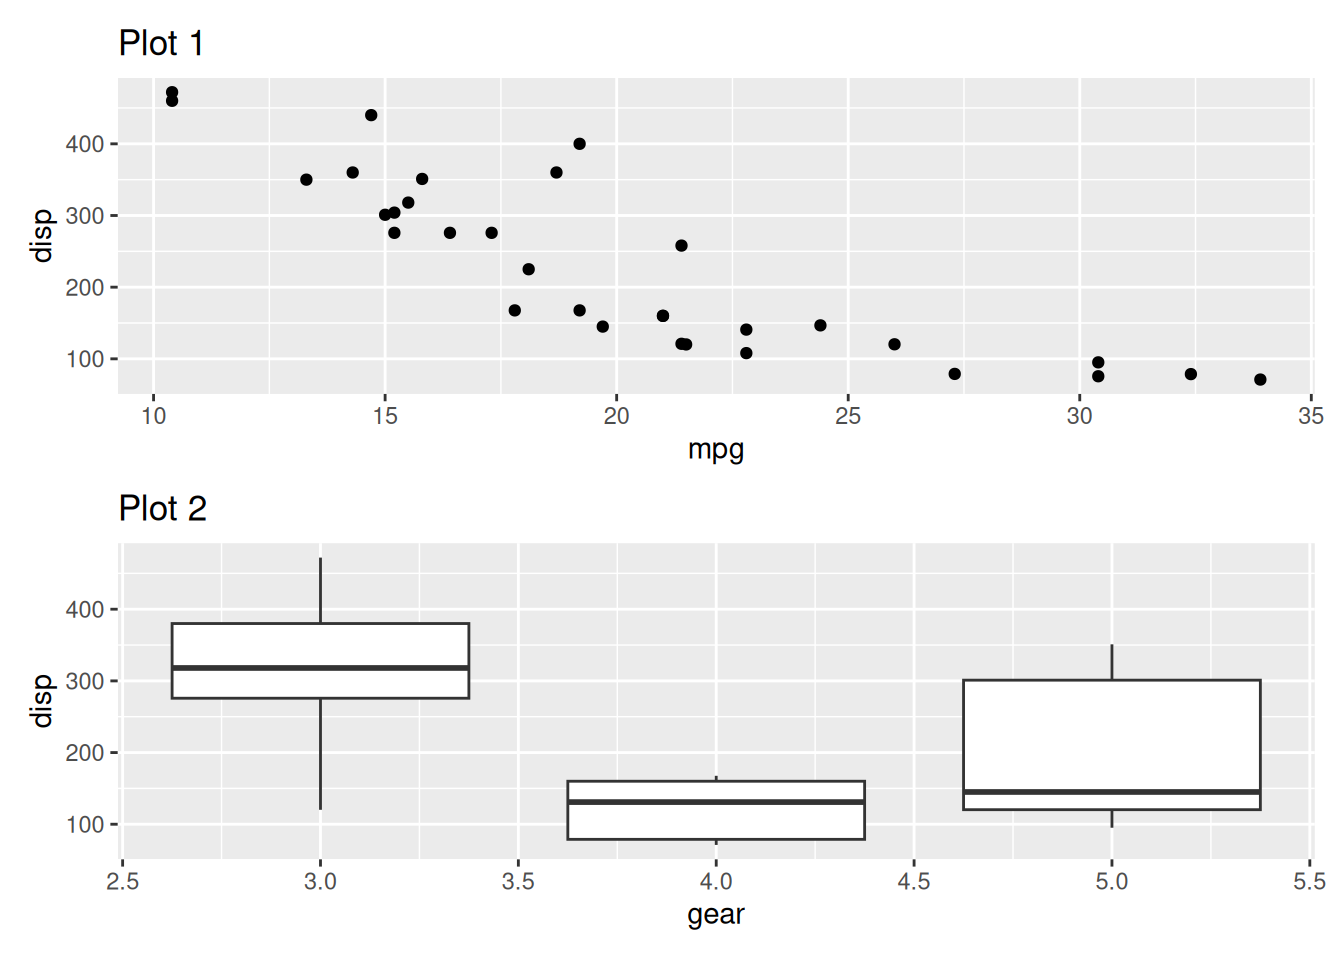
Align a list of plots:
align_plots(!!!list(p1, p2, p3))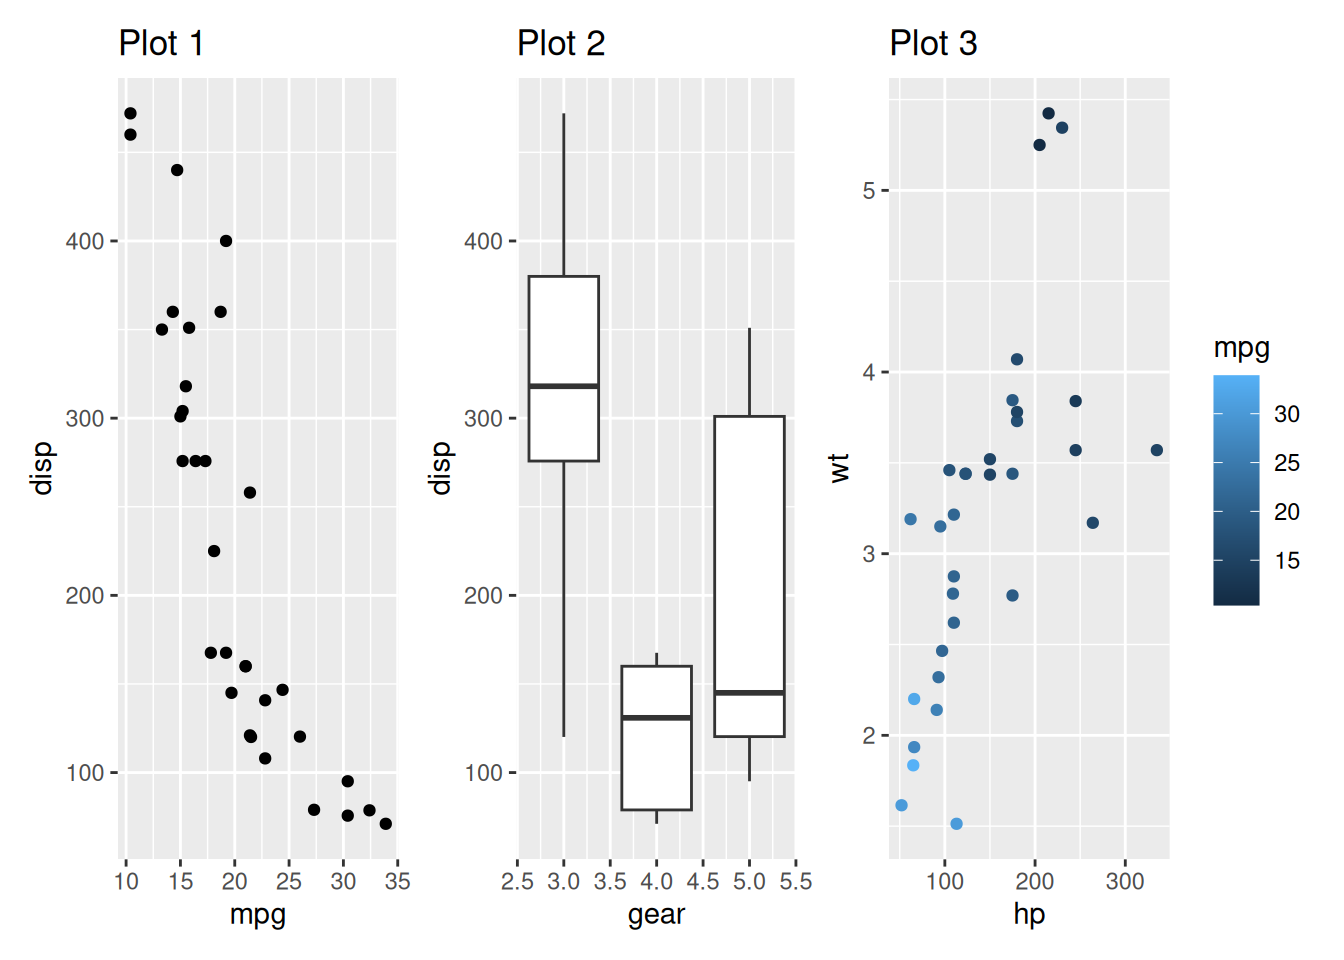
Set different width for plots:
align_plots(p1, p2, widths = c(2, 1))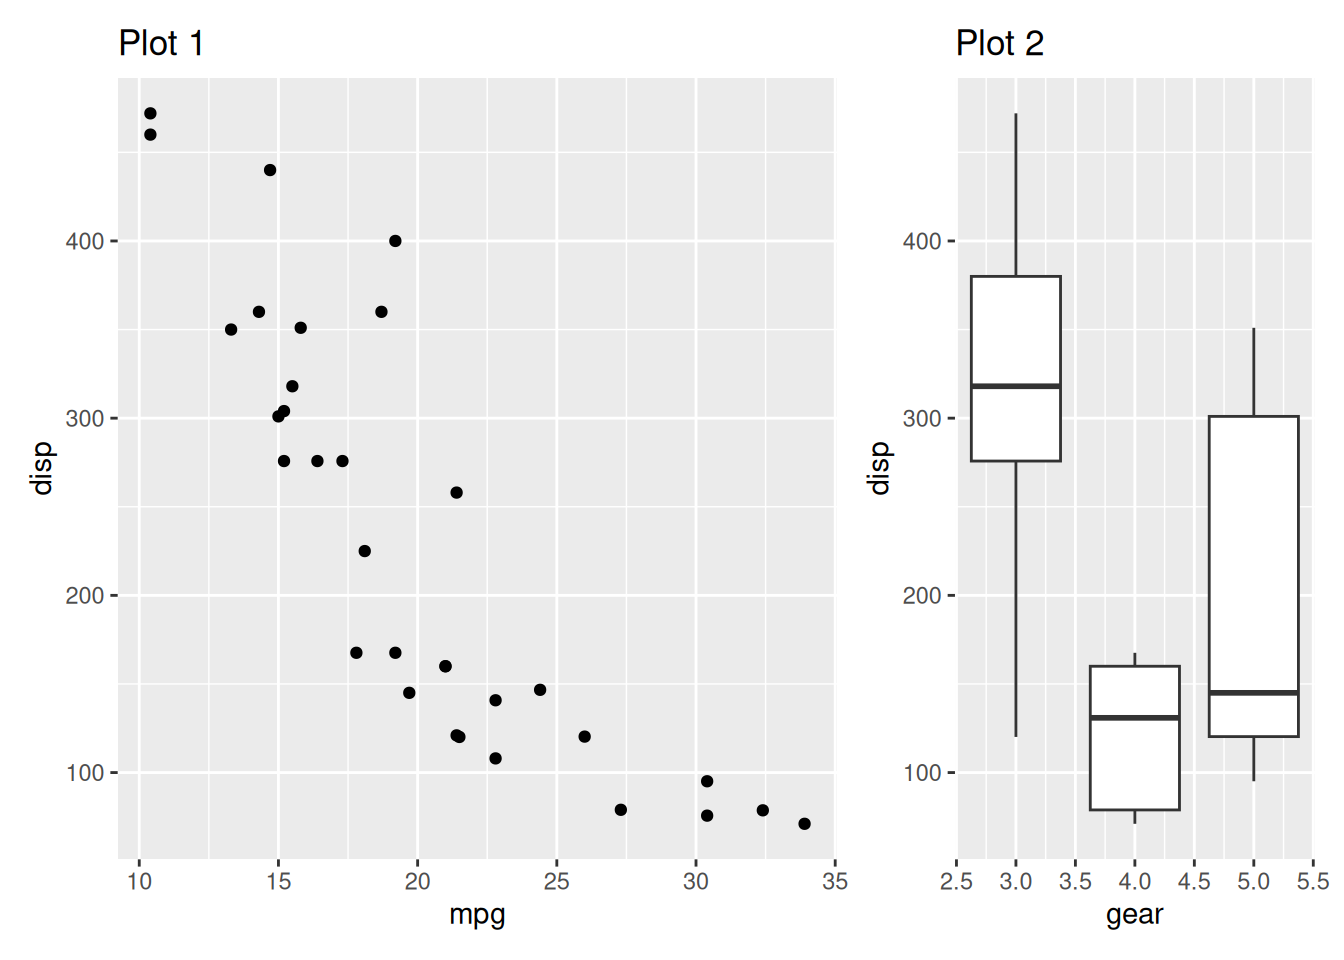
Works for multiple plots:
align_plots(p1, p2, p3, p4, ncol = 2, widths = c(2, 1))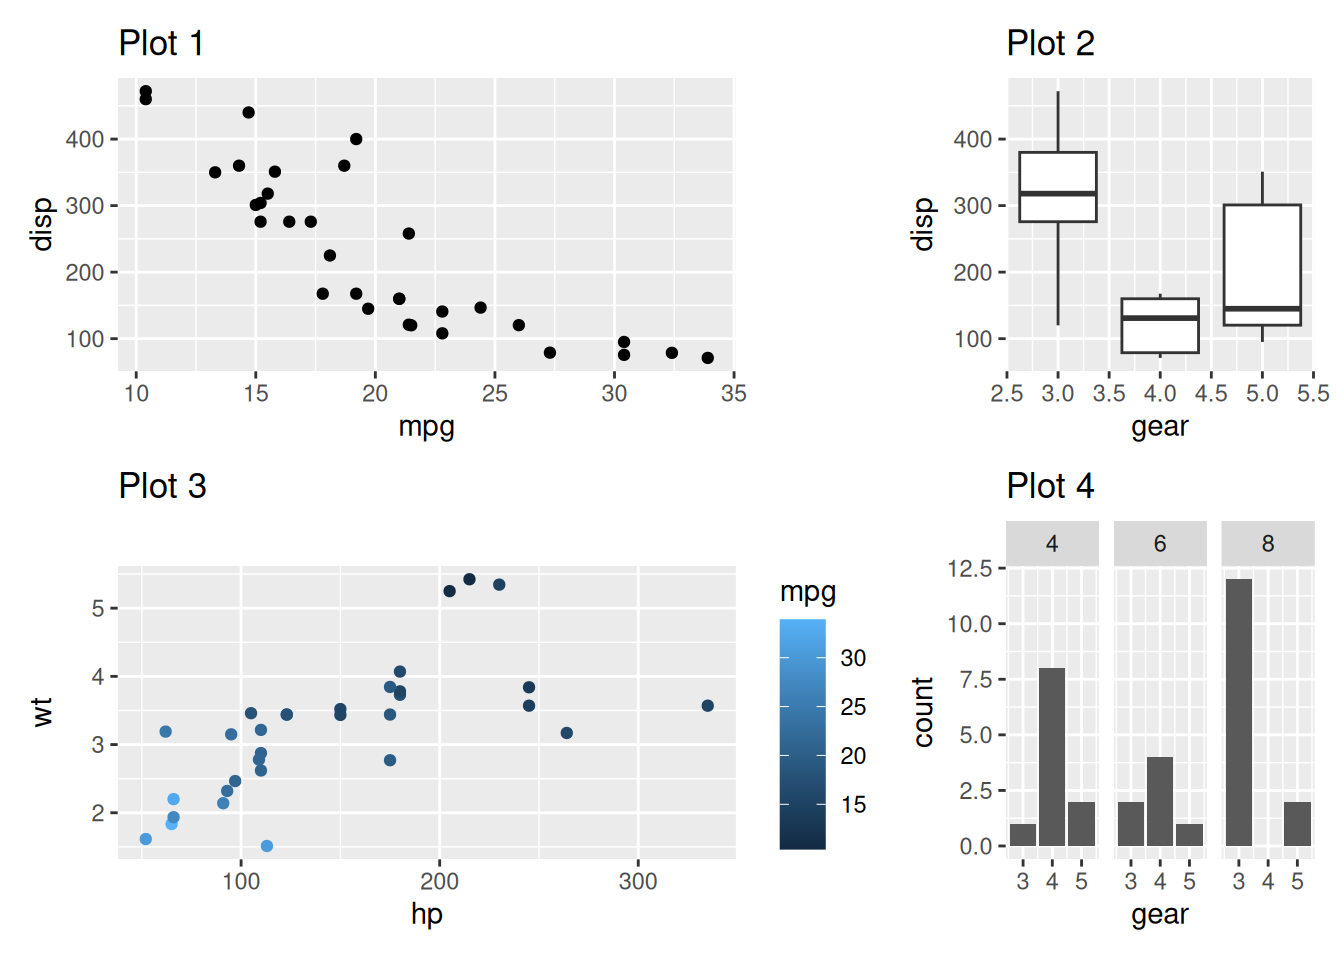
Add empty plot:
align_plots(p1, NULL, p2)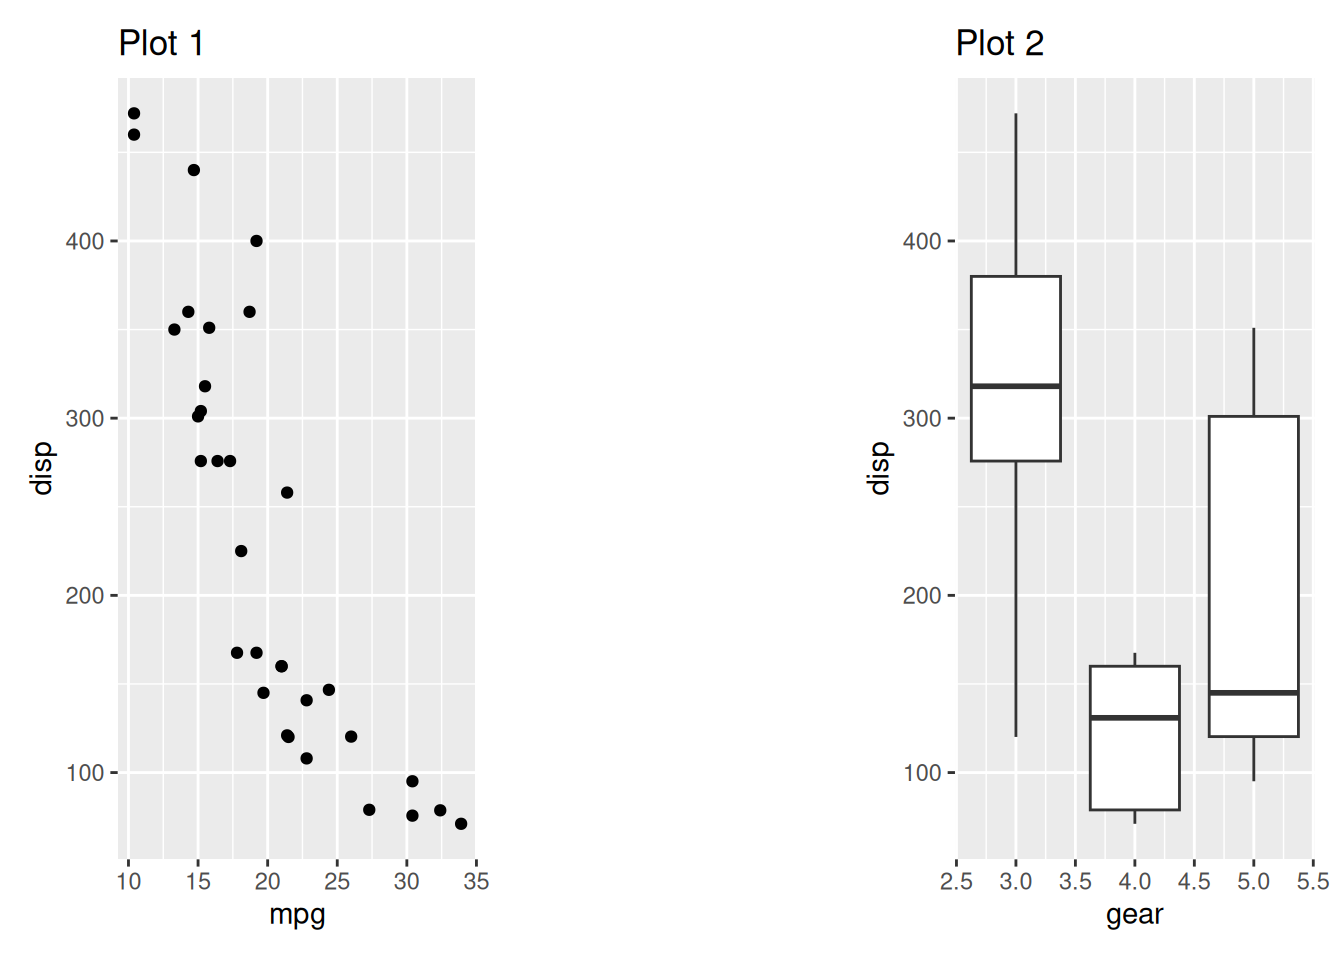
More see Data-Free Composition of ggalign tutorial book.
