library(ggalign)
#> Loading required package: ggplot2
#> ========================================
#> ggalign version 1.2.0.9000
#>
#> If you use it in published research, please cite:
#> Peng, Y.; Jiang, S.; Song, Y.; et al. ggalign: Bridging the Grammar of Graphics and Biological Multilayered Complexity. Advanced Science. 2025. doi:10.1002/advs.202507799
#> ========================================align_plots()
Plot Composer - Inset
library(grid)
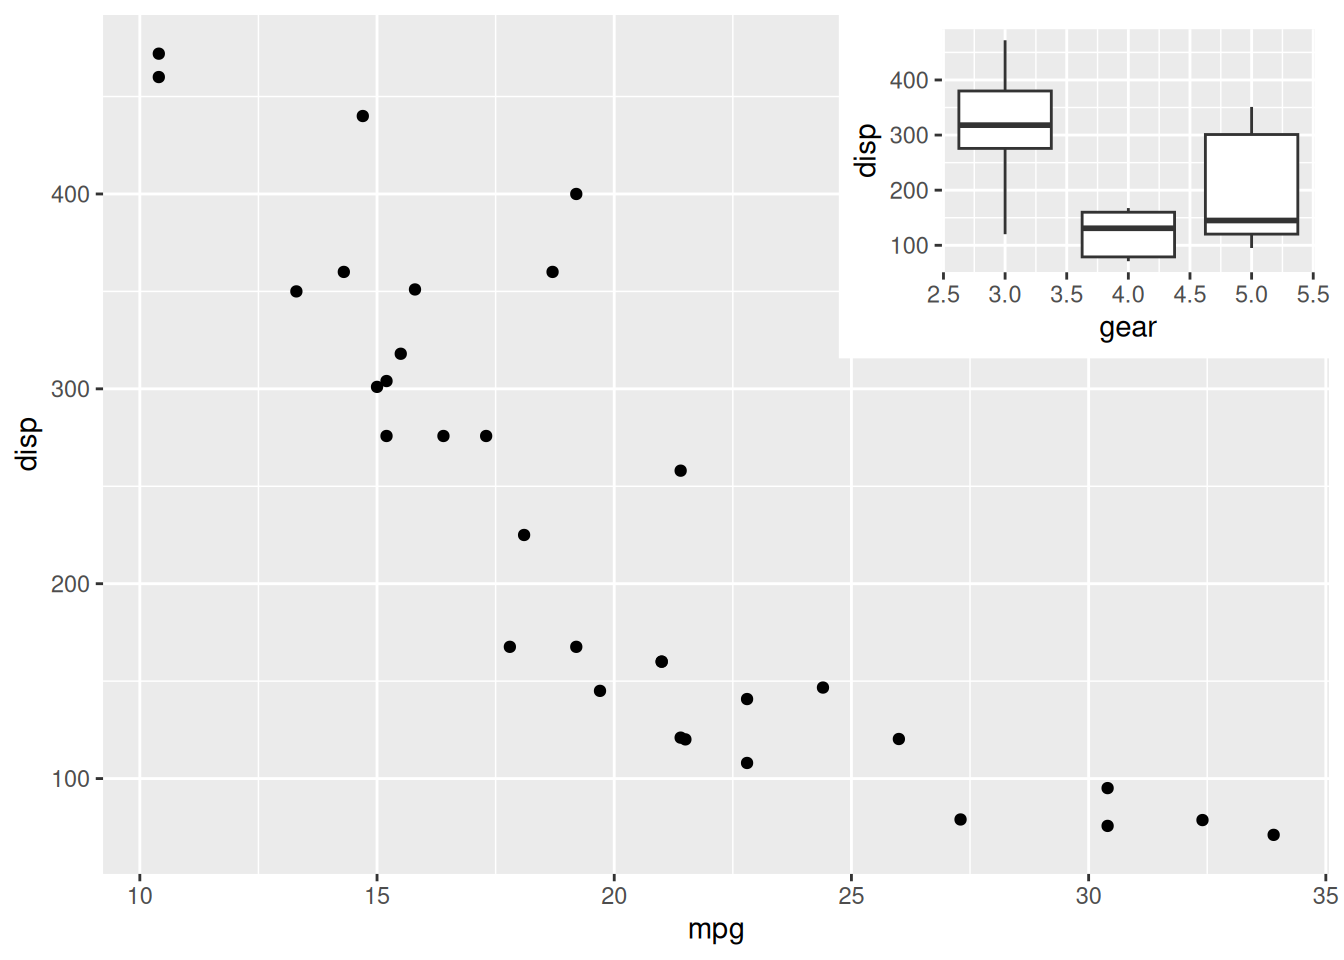
# Create the main scatter plot: mpg vs disp
p1 <- ggplot(mtcars) +
geom_point(aes(mpg, disp))
# Create the inset plot: boxplot of disp by gear
p2 <- ggplot(mtcars) +
geom_boxplot(aes(gear, disp, group = gear))
# Compose the plots: insert p2 into p1 using a viewport
p1 + inset(p2, vp = viewport(0.6, 0.6,
just = c(0, 0), width = 0.4, height = 0.4
))