library(ggalign)
#> Loading required package: ggplot2
#> ========================================
#> ggalign version 1.2.0.9000
#>
#> If you use it in published research, please cite:
#> Peng, Y.; Jiang, S.; Song, Y.; et al. ggalign: Bridging the Grammar of Graphics and Biological Multilayered Complexity. Advanced Science. 2025. doi:10.1002/advs.202507799
#> ========================================align_plots()
Plot Composer – Arbitrary Plots
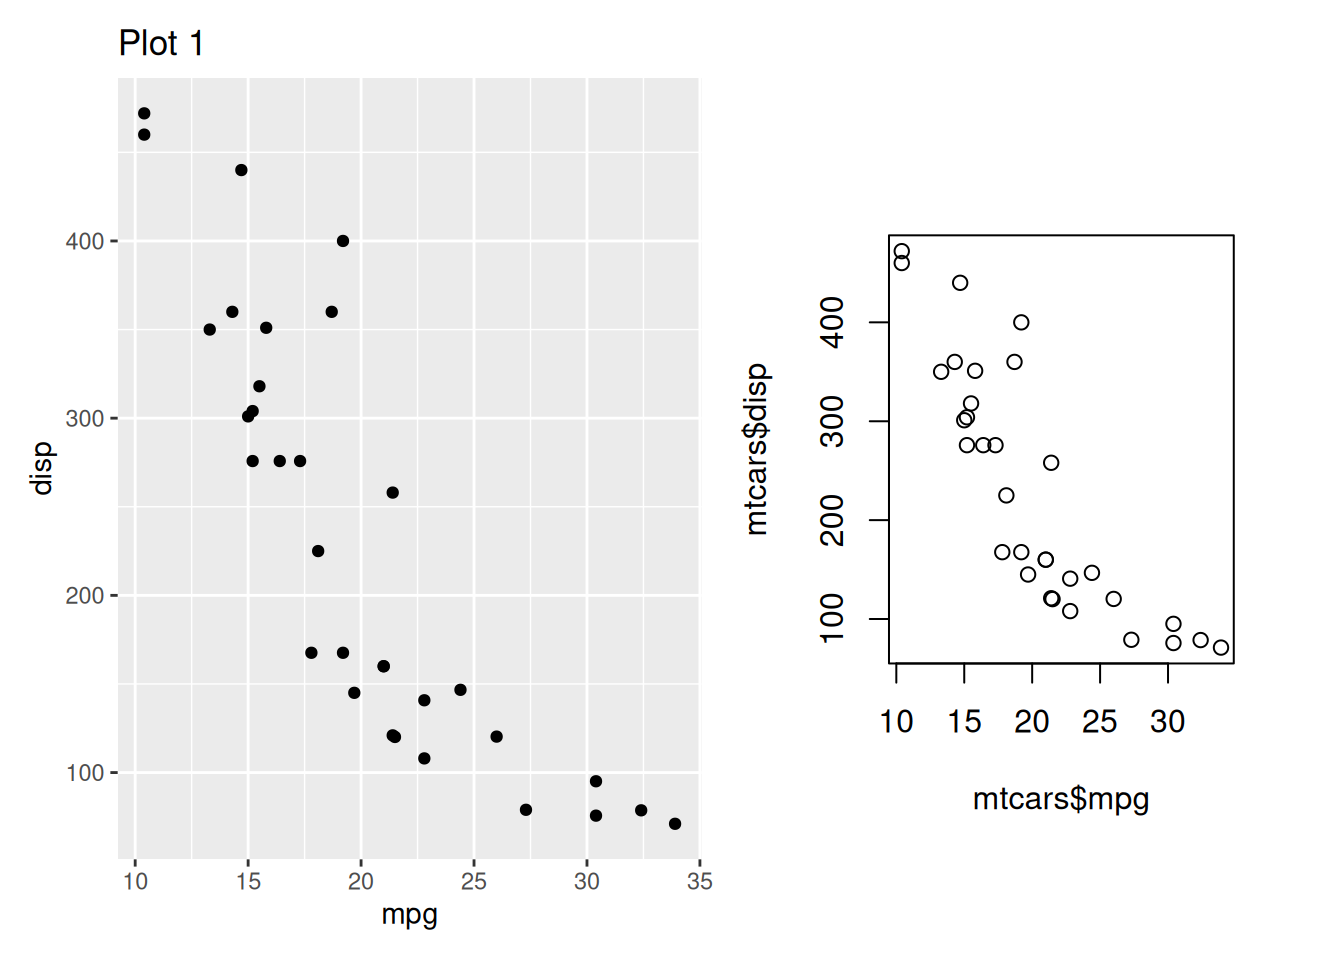
The ggalign package includes the ggwrap() function, which enables the conversion of non-ggplot2 elements into a general object that is compatible with align_plots(). This provides a versatile tool for incorporating any type of graphics within R.
p1 <- ggplot(mtcars) +
    geom_point(aes(mpg, disp)) +
    ggtitle("Plot 1")
Add base plot:
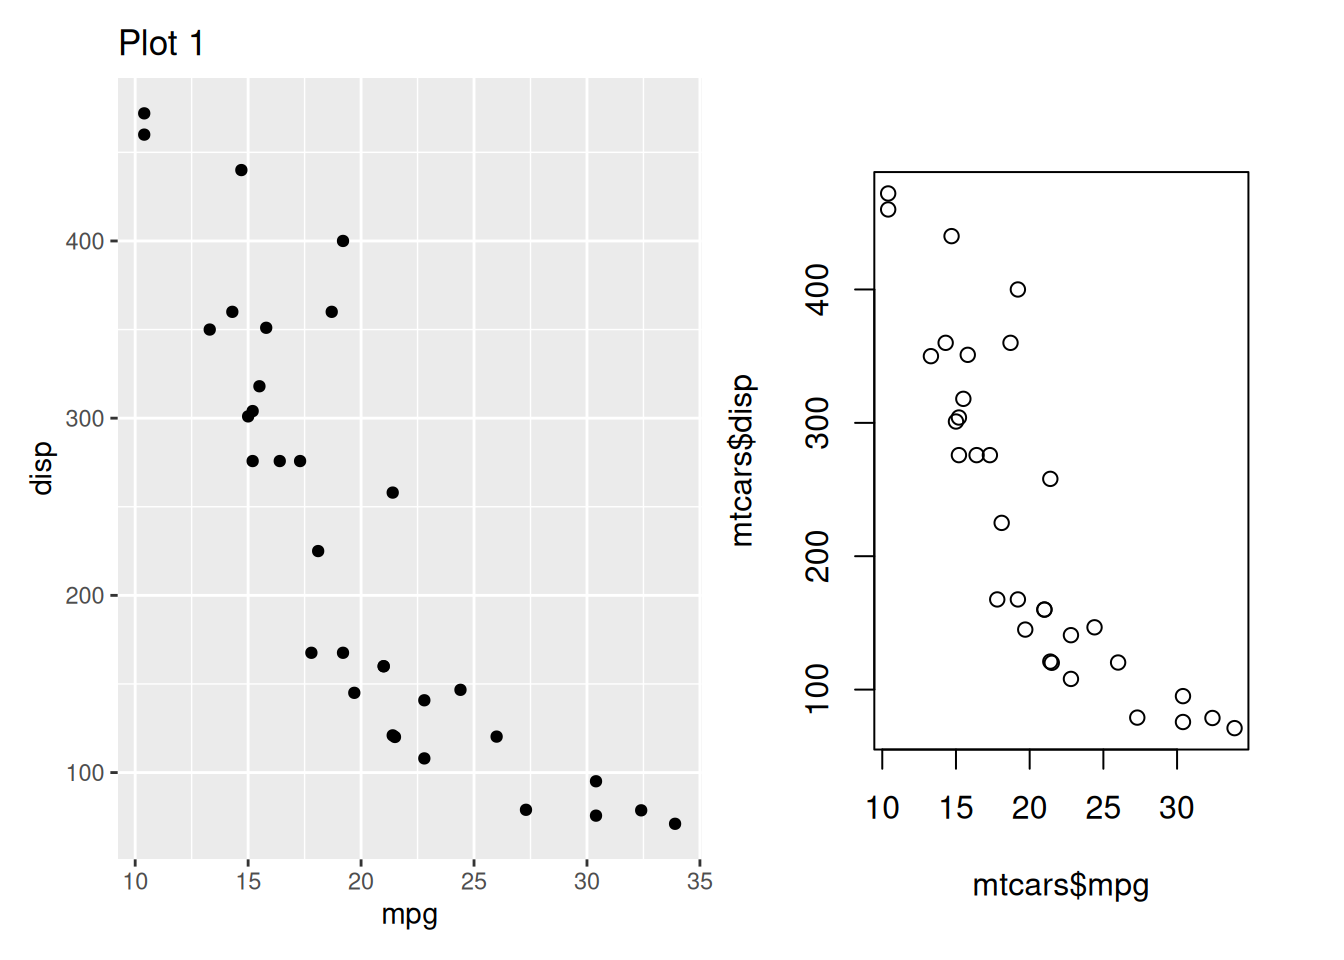
align_plots(p1, ggwrap(~ plot(mtcars$mpg, mtcars$disp)))
base plot should be provided using formula.
align_plots(
    p1,
    ggwrap(
        ~ plot(mtcars$mpg, mtcars$disp),
        align = "full"
    )
)
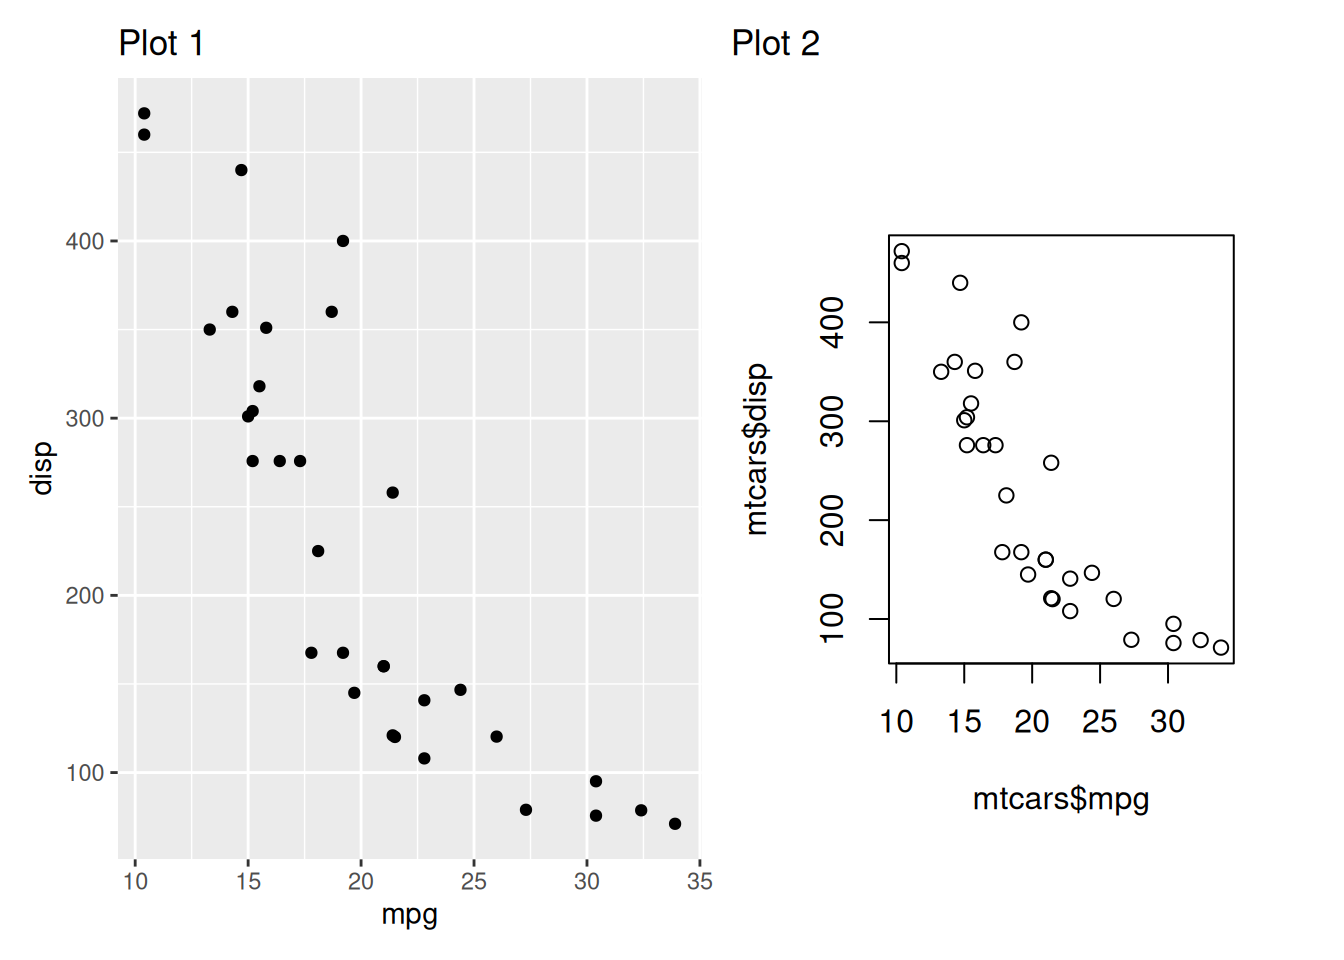
align_plots(
    p1,
    ggwrap(~ plot(mtcars$mpg, mtcars$disp)) +
        # add title for new plot
        ggtitle("Plot 2")
)
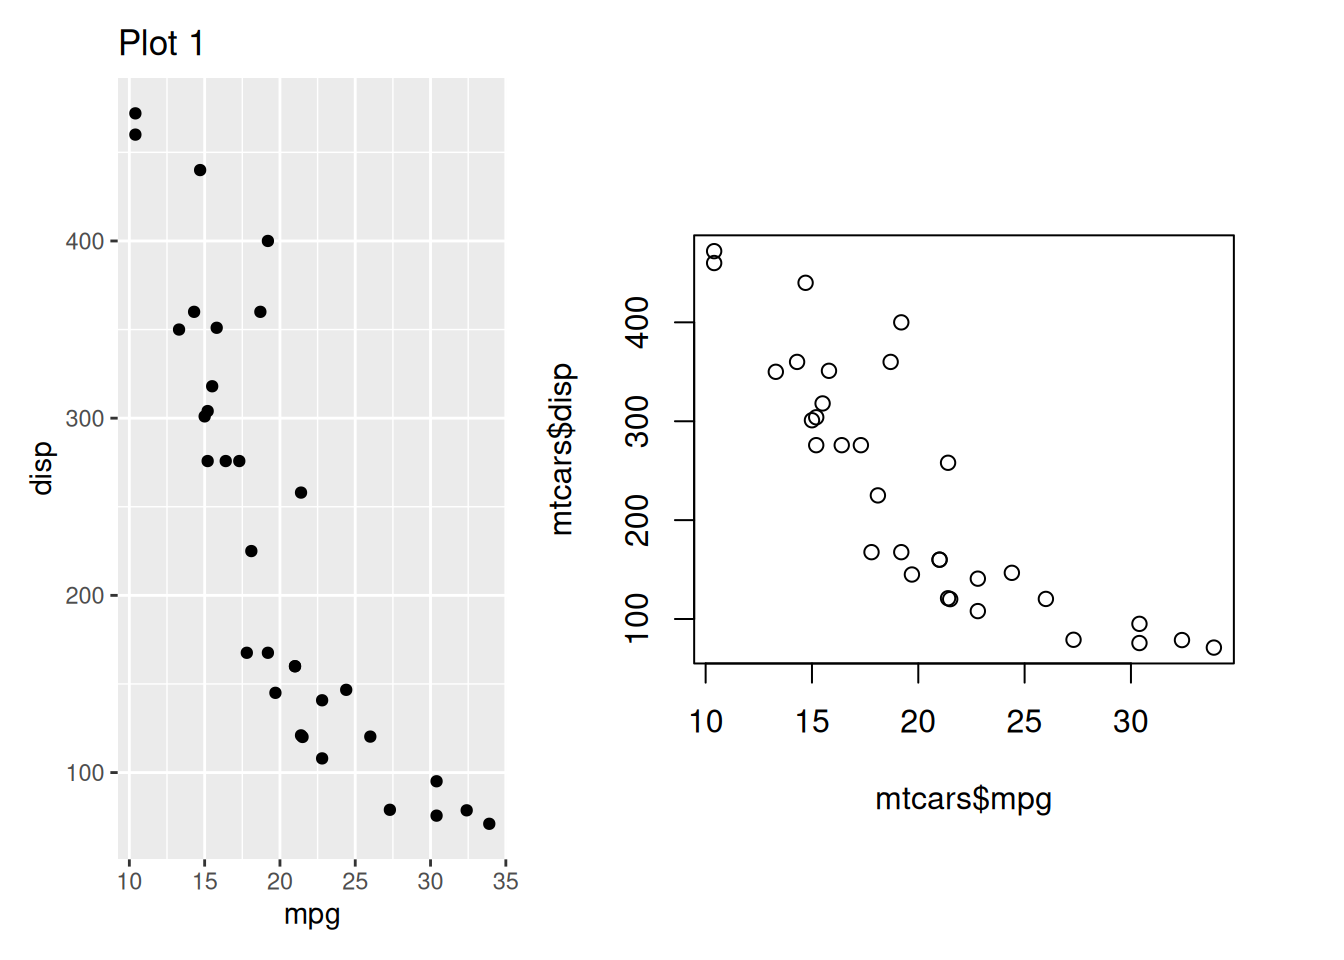
Set plot widths:
align_plots(
    p1,
    ggwrap(~ plot(mtcars$mpg, mtcars$disp)),
    widths = c(1, 2)
)
Since ggwrap() is automatically called in most cases, you can write code like:
align_plots(
    p1,
    ~ plot(mtcars$mpg, mtcars$disp)
)
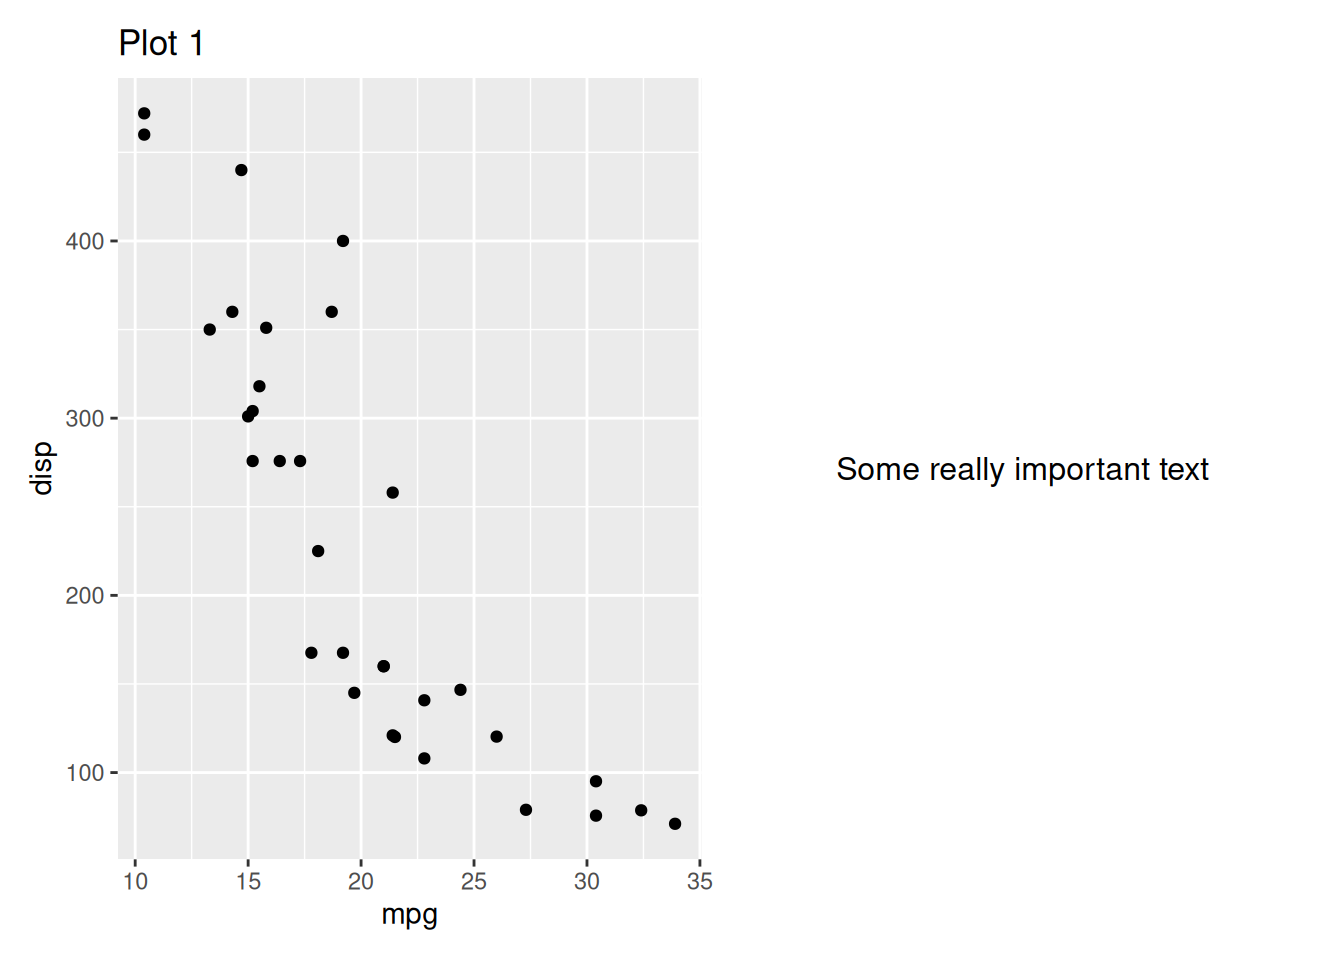
Add grid grobs, for example:
align_plots(
    p1,
    grid::textGrob("Some really important text")
)
Add cluster plot:
hc <- hclust(dist(USArrests), "ave")
align_plots(p1, ~ plot(hc))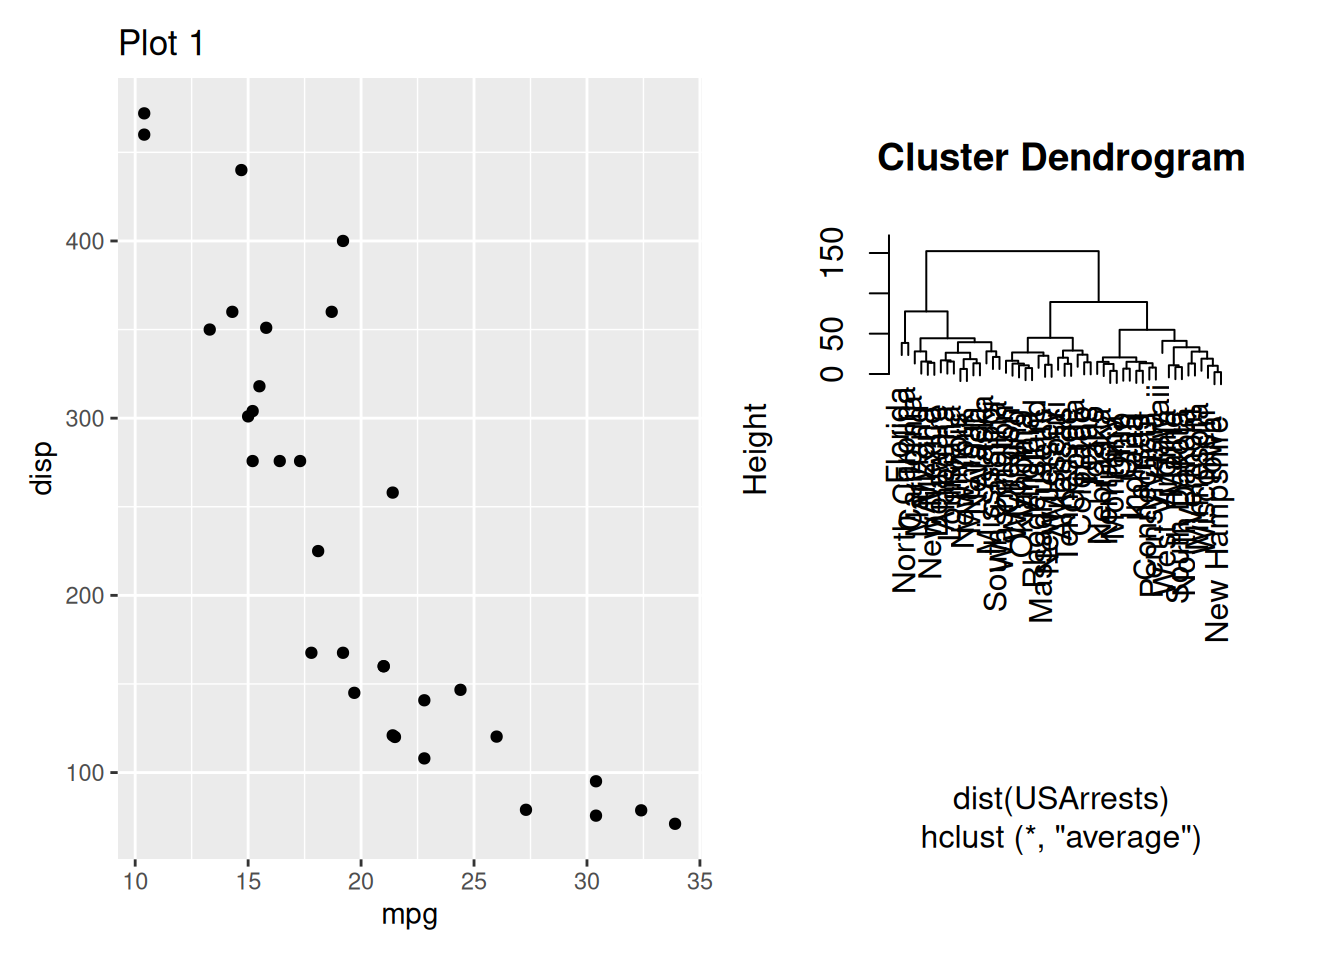
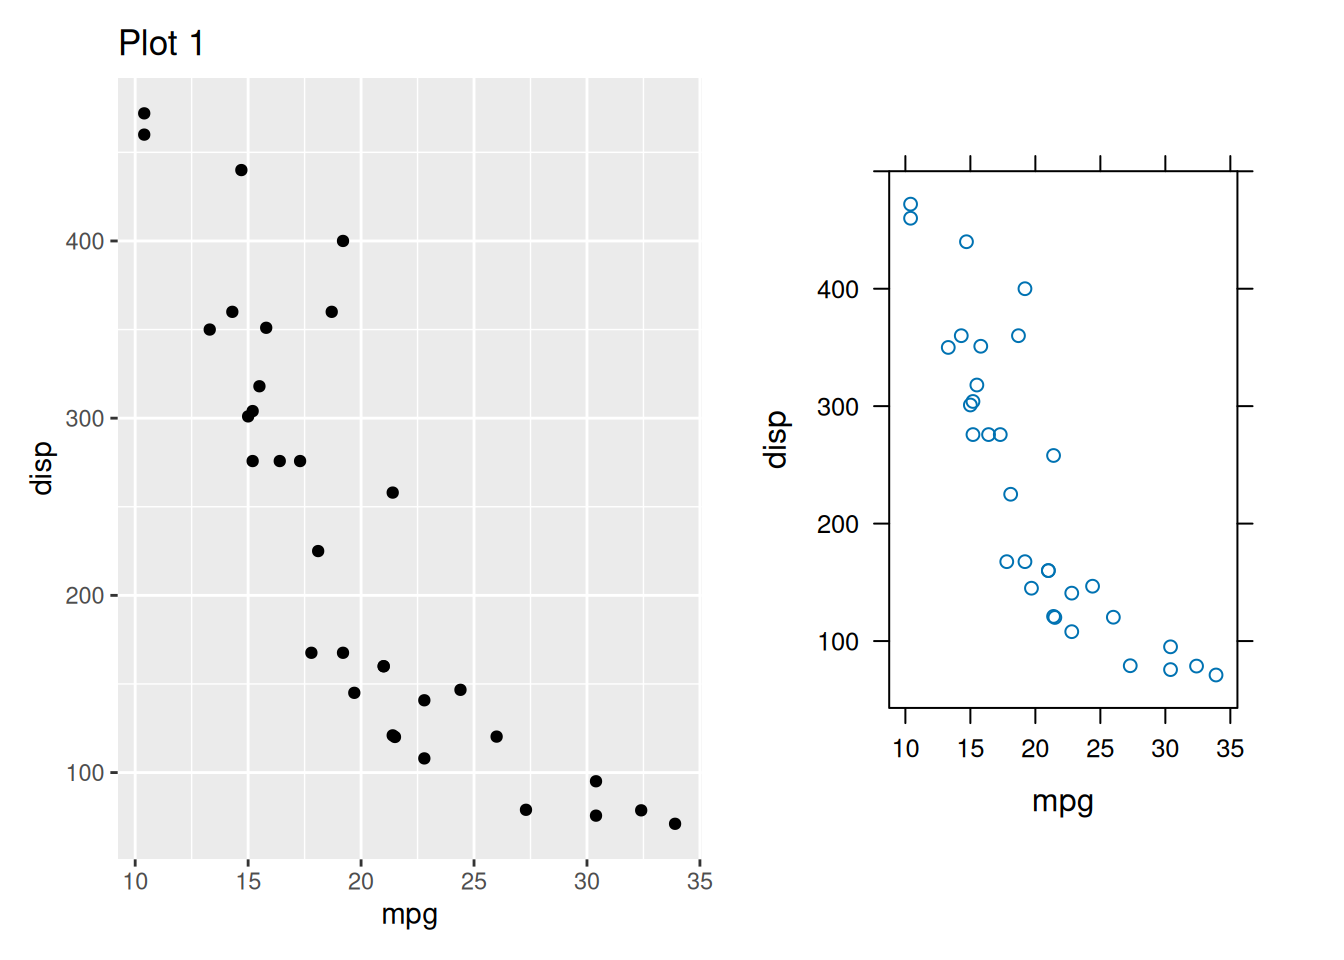
Add lattice plots:
align_plots(
    p1,
    lattice::xyplot(disp ~ mpg, data = mtcars)
)
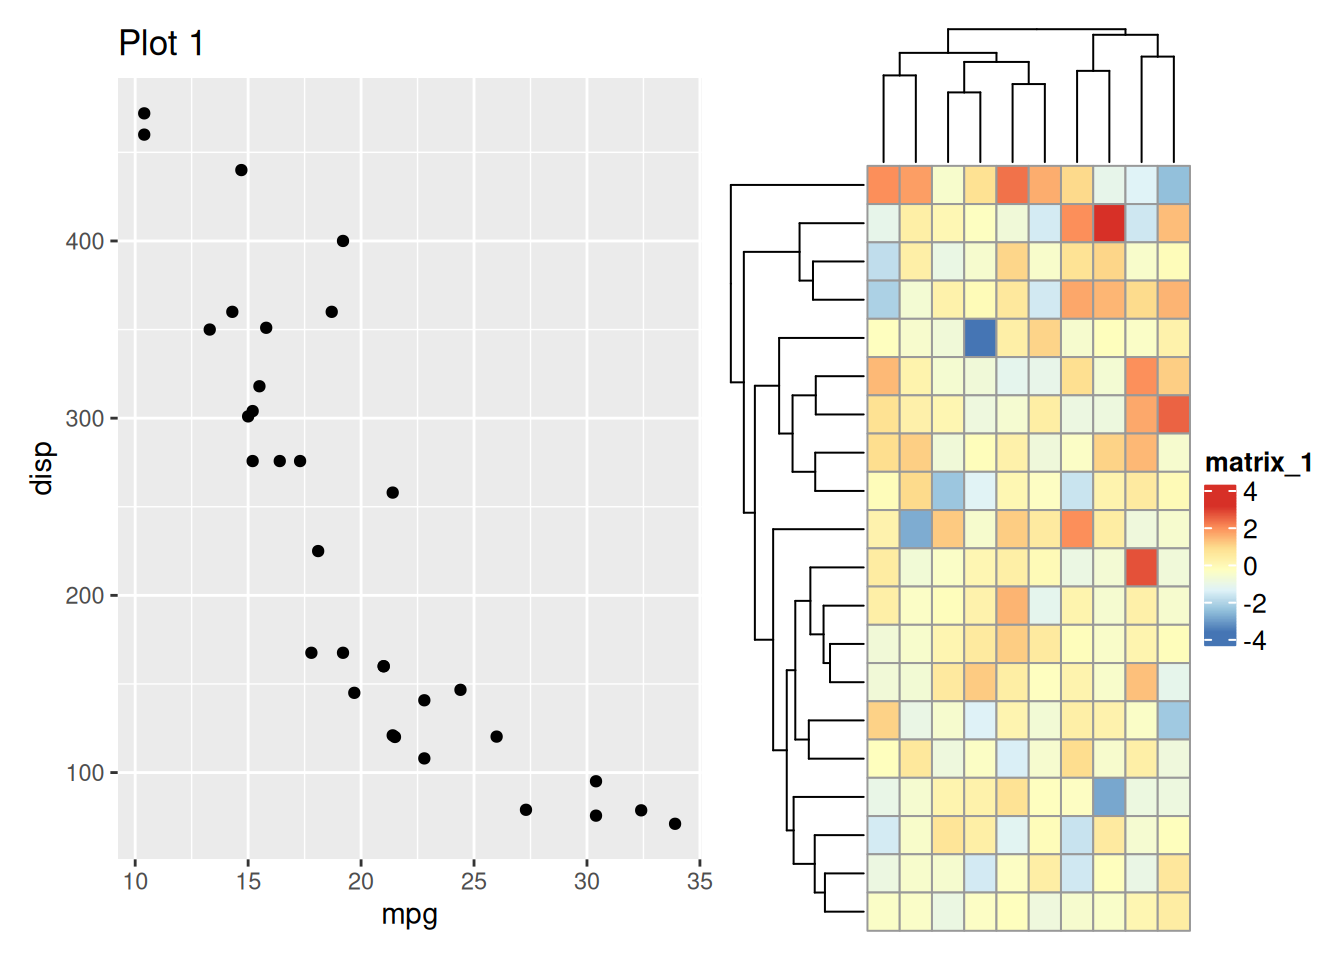
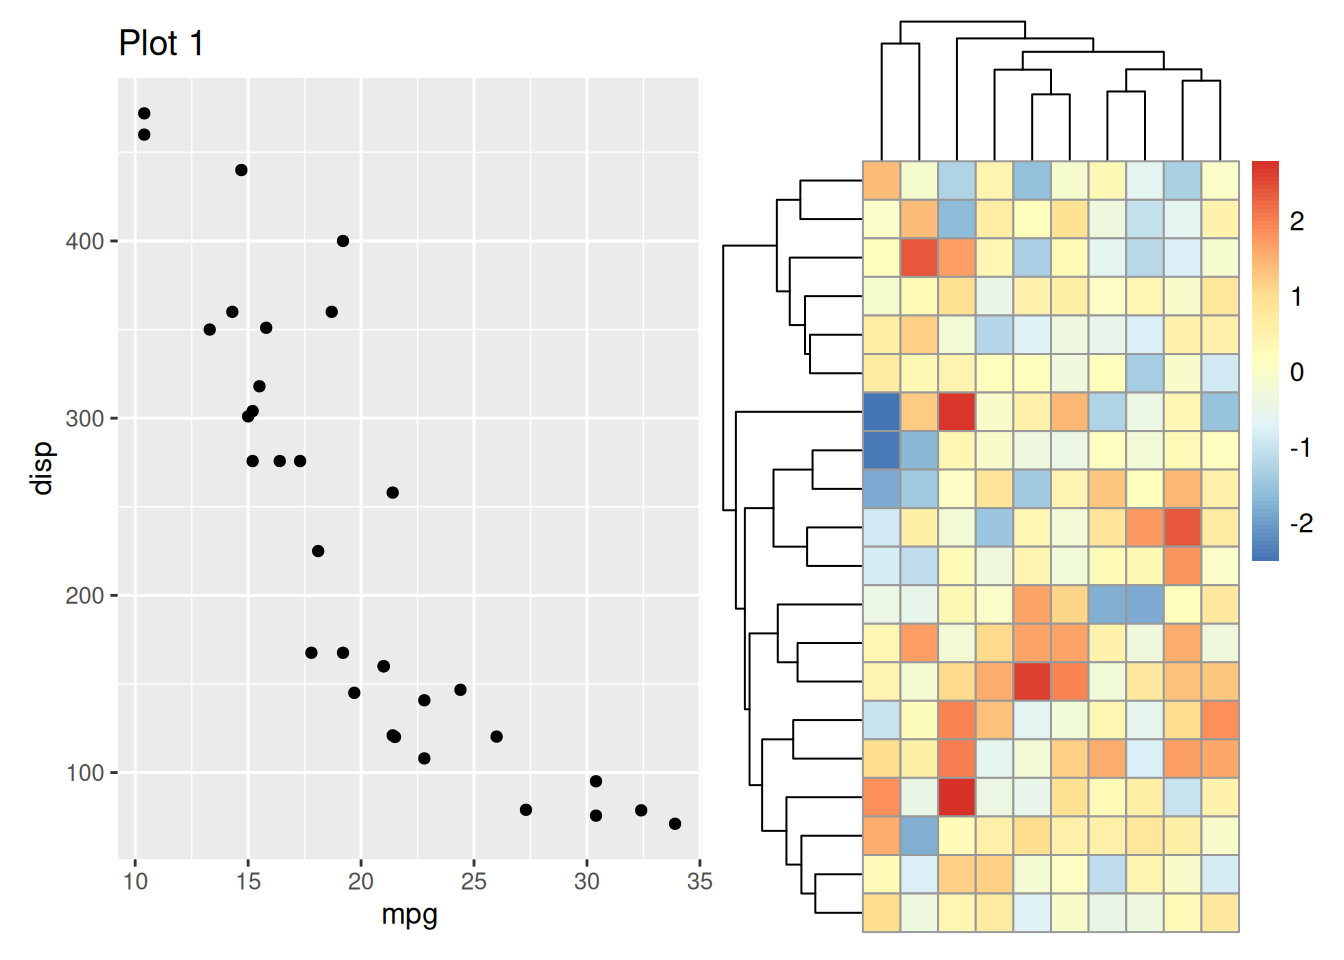
Add pheatmap:
align_plots(
    p1,
    pheatmap::pheatmap(matrix(rnorm(200), 20, 10), silent = TRUE)
)
Add ComplexHeatmap:
align_plots(
    p1,
    ComplexHeatmap::pheatmap(matrix(rnorm(200), 20, 10))
)