library(ggalign)
#> Loading required package: ggplot2
#> ========================================
#> ggalign version 1.2.0.9000
#>
#> If you use it in published research, please cite:
#> Peng, Y.; Jiang, S.; Song, Y.; et al. ggalign: Bridging the Grammar of Graphics and Biological Multilayered Complexity. Advanced Science. 2025. doi:10.1002/advs.202507799
#> ========================================stack_discrete()
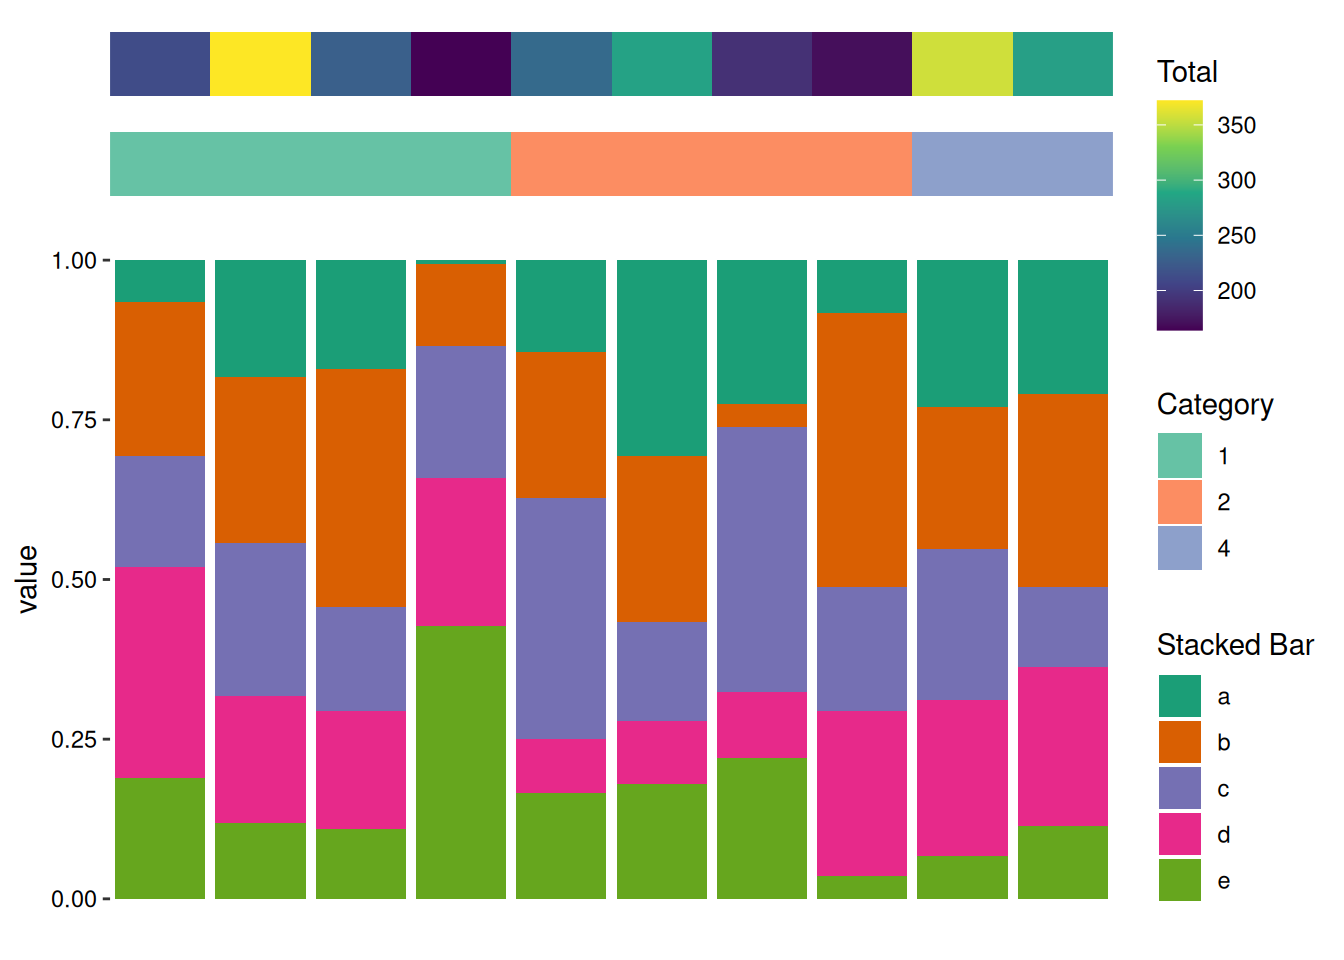
Stacked bar
stack_discretev(data) +

    # add bar for total
    ggalign(rowSums, size = 0.1) +
    geom_tile(aes(y = 1, fill = value)) +
    scale_fill_viridis_c(name = "Total") +

    # add bar for catogery
    ggalign(factor(category), size = 0.1) +
    geom_tile(aes(y = 1, fill = value)) +
    scale_fill_brewer(palette = "Set2", name = "Category") -
    scale_y_continuous(breaks = NULL, name = NULL) +

    ggalign() +
    geom_bar(aes(y = value, fill = .column_names),
        stat = "identity", position = position_fill()
    ) +
    scale_fill_brewer(palette = "Dark2", name = "Stacked Bar")