library(ggalign)
#> Loading required package: ggplot2
#> ========================================
#> ggalign version 1.2.0.9000
#>
#> If you use it in published research, please cite:
#> Peng, Y.; Jiang, S.; Song, Y.; et al. ggalign: Bridging the Grammar of Graphics and Biological Multilayered Complexity. Advanced Science. 2025. doi:10.1002/advs.202507799
#> ========================================ggheatmap()
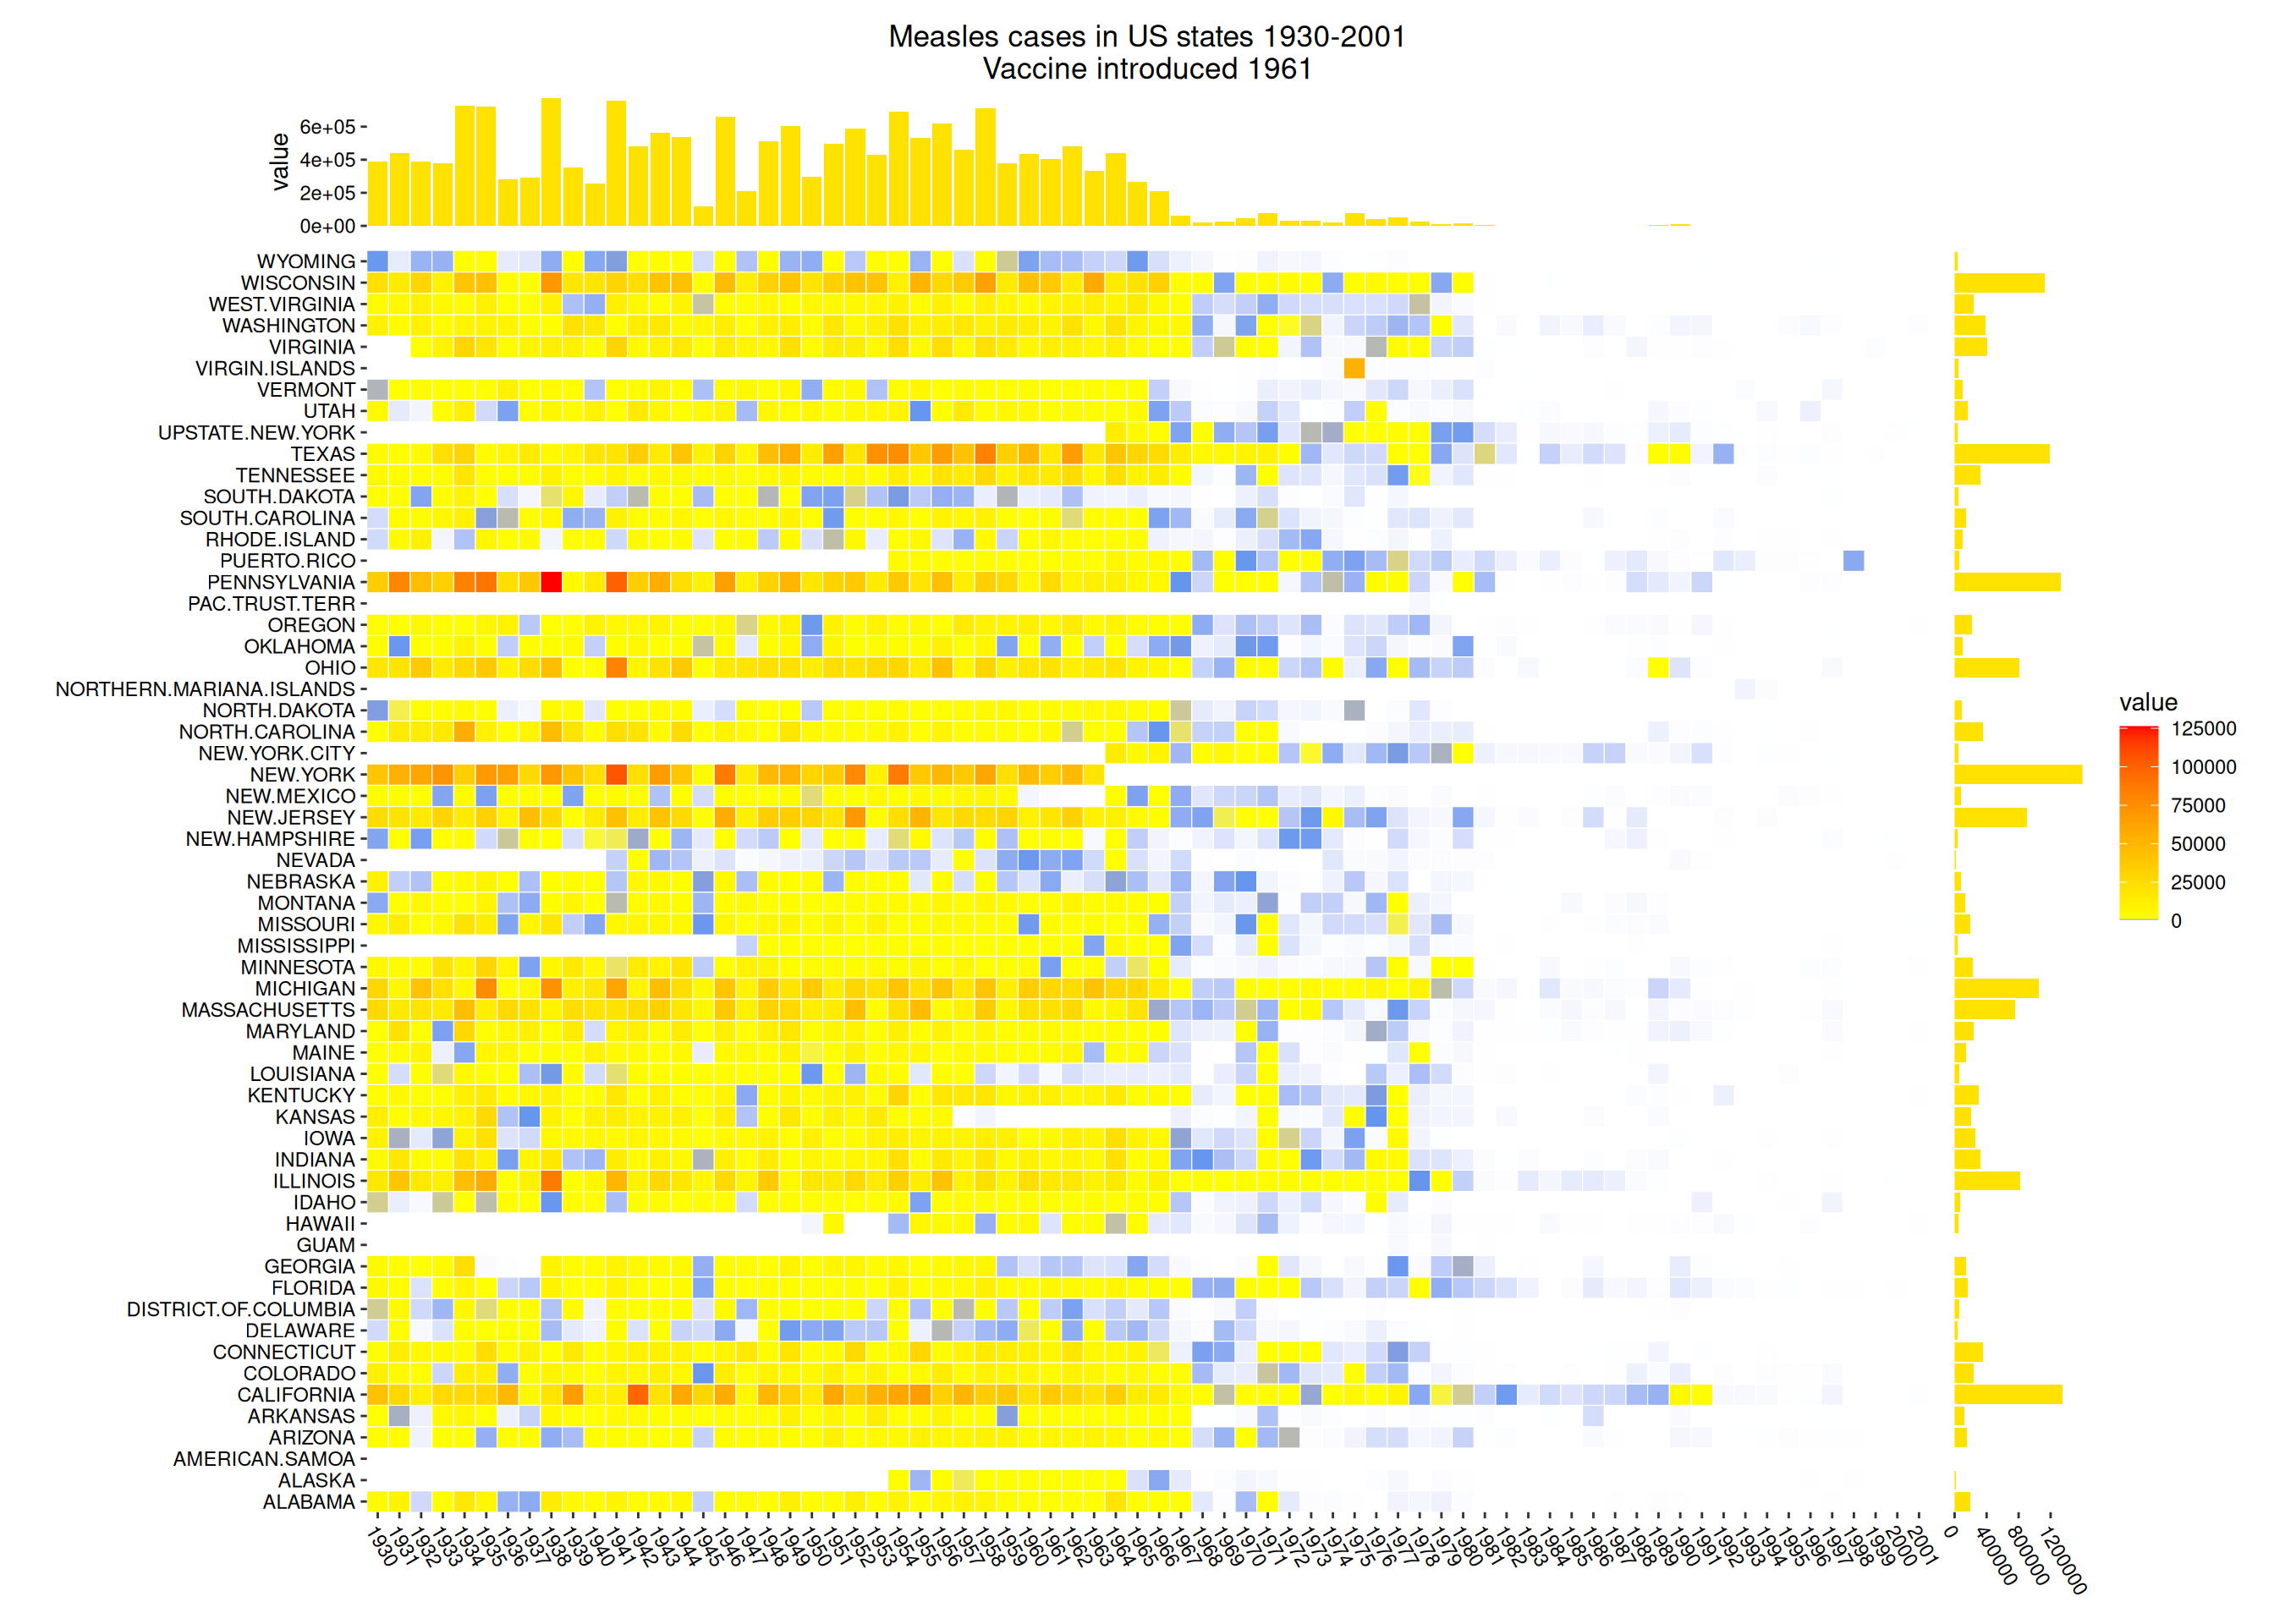
Measles Vaccine Heatmap
We utilize the measles vaccine dataset included in the R ComplexHeatmap package to reproduce the figure from https://jokergoo.github.io/ComplexHeatmap-reference/book/more-examples.html.
mat <- mat <- readRDS(
    system.file("extdata", "measles.rds", package = "ComplexHeatmap")
)
ggheatmap(mat, filling = FALSE) +
    geom_tile(aes(fill = value), color = "white") +
    scale_fill_gradientn(
        colours = c("white", "cornflowerblue", "yellow", "red"),
        values = scales::rescale(c(0, 800, 1000, 127000), c(0, 1))
    ) +
    theme(axis.text.x = element_text(angle = -60, hjust = 0)) +
    anno_top(size = unit(2, "cm")) +
    ggalign(data = rowSums) +
    geom_bar(aes(y = value), fill = "#FFE200", stat = "identity") +
    scale_y_continuous(expand = expansion()) +
    ggtitle("Measles cases in US states 1930-2001\nVaccine introduced 1961") +
    theme(plot.title = element_text(hjust = 0.5)) +
    anno_right(size = unit(2, "cm")) +
    ggalign(data = rowSums) +
    geom_bar(aes(x = value),
        fill = "#FFE200", stat = "identity",
        orientation = "y"
    ) +
    scale_x_continuous(expand = expansion(), name = NULL) +
    theme(axis.text.x = element_text(angle = -60, hjust = 0))