We utilize the TCGA LAML mutation dataset included in the R maftools package.
To reduce complexity, we randomly sample 20 tumor samples. The data preparation code is initially collapsed in the source but can be expanded for inspection.
Code
# load data from `maftools`laml.maf<-system.file("extdata", "tcga_laml.maf.gz", package ="maftools")# clinical information containing survival information and histology. This is optionallaml.clin<-system.file("extdata", "tcga_laml_annot.tsv", package ="maftools")laml<-maftools::read.maf( maf =laml.maf, clinicalData =laml.clin, verbose =FALSE)set.seed(25)# 2, 11, 20, 25, 29, 32new_laml<-maftools::subsetMaf(laml, tsb =sample(maftools::getClinicalData(laml)$Tumor_Sample_Barcode, 20))#> -Processing clinical data
library(ggalign)#> Loading required package: ggplot2#> ========================================#> ggalign version 1.2.0.9000#> #> If you use it in published research, please cite: #> Peng, Y.; Jiang, S.; Song, Y.; et al. ggalign: Bridging the Grammar of Graphics and Biological Multilayered Complexity. Advanced Science. 2025. doi:10.1002/advs.202507799#> ========================================
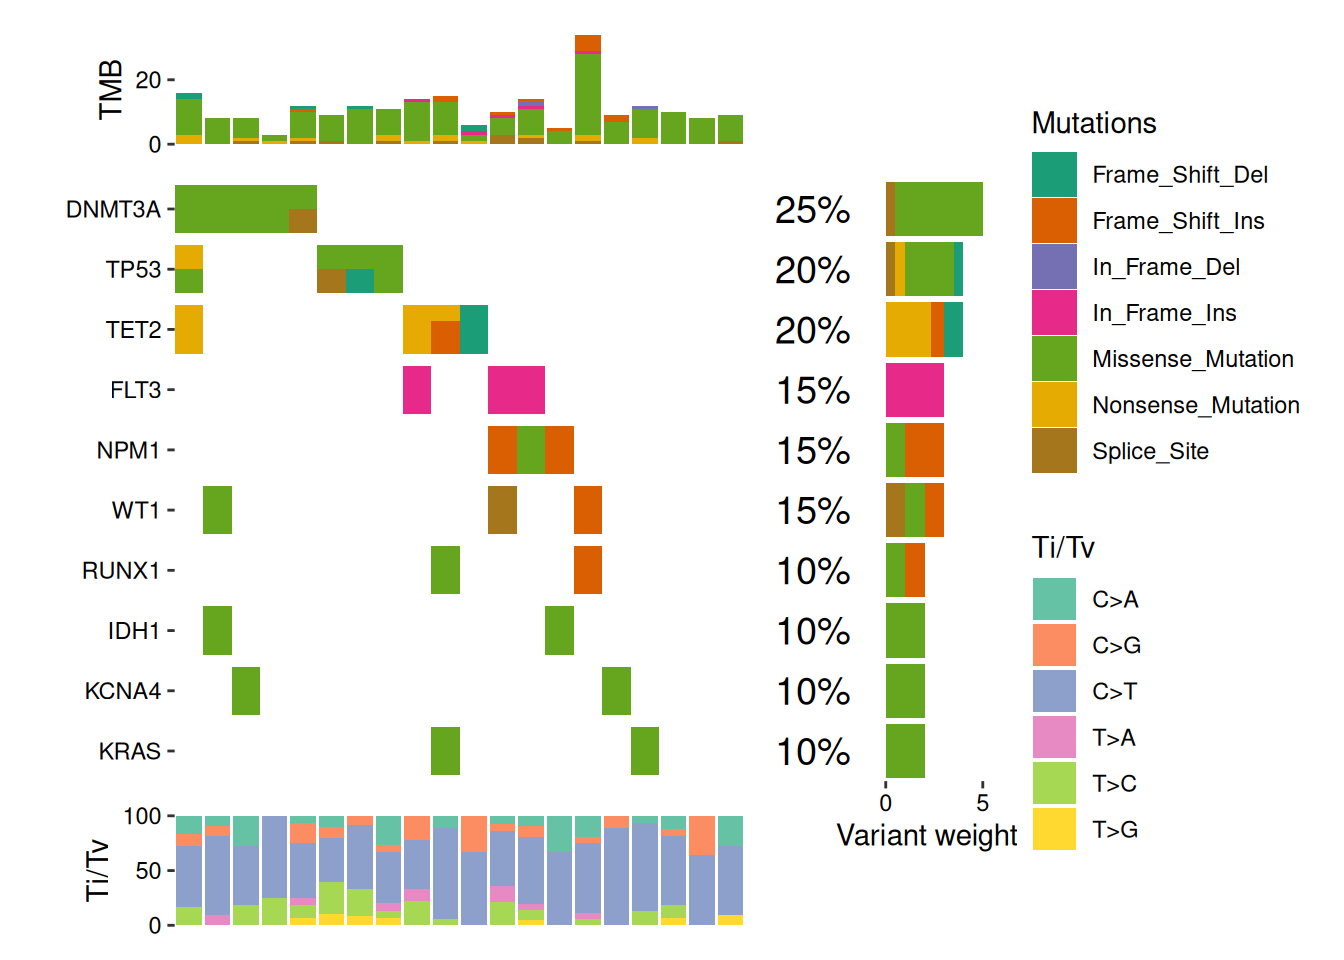
ggoncoplot(new_laml, n_top =10, collapse_vars =FALSE, filling =FALSE, remove_empty_samples =FALSE)+geom_subtile(aes(fill =value), ncol =1L, height =0.8, show.legend =TRUE)+theme_no_axes("x")+# add top annotation -------------------------------anno_top(size =0.2)+ggalign( data =function(data){vars<-ggalign_lvls(data)data<-ggalign_attr(data, "sample_summary")as.matrix(data[intersect(names(data), vars)])})+scheme_data(function(data){data$.column_names<-factor(data$.column_names, ggalign_lvls(data))data})+geom_bar(aes(.x, value, fill =.column_names), stat ="identity")+guides(fill ="none")+ylab("TMB")+scale_y_continuous(breaks =scales::breaks_pretty(2L))+# add right annotation -----------------------------anno_right(size =0.4)-# remove bottom spaces of the right annotation when aligningscheme_align(free_spaces ="b")+# add the text percent for the alterated samples in the right annotationggalign( data =function(data){# Atomic vector will be converted into a data frame.ggalign_attr(data, "gene_summary")$AlteredSamples/ggalign_attr(data, "n_samples")})+geom_text(aes(1, label =scales::label_percent()(value)), hjust =1.2, size =5, family ="Helvetica")+scale_x_continuous( expand =expansion(), name =NULL, breaks =NULL, limits =c(0, 1))+theme(plot.margin =margin())+# add the bar plot in the right annotationggalign(data =function(data){vars<-ggalign_lvls(data)data<-ggalign_attr(data, "variant_weights")as.matrix(data[intersect(names(data), vars)])})+scheme_data(function(data){data$.column_names<-factor(data$.column_names, ggalign_lvls(data))data})+geom_bar(aes(value, fill =.column_names), stat ="identity", orientation ="y")+guides(fill ="none")+# labs(fill = "right") +xlab("Variant weights")+scale_x_continuous(breaks =scales::breaks_pretty(1))-# we apply the scale mapping to# - the top and right annotation: `position = "tr"`# - the main plot: `position = "i"`quad_scope(scale_fill_brewer("Mutations", palette ="Dark2", na.translate =FALSE, drop =FALSE), position ="tri")+# add bottom annotation ----------------------------anno_bottom(size =0.2)+# add bar plot in the bottom annotationggalign(data =function(data){data<-ggalign_attr(data, "titv")$fraction.contributionas.matrix(data[-1L])})+geom_bar(aes(y =value, fill =.column_names), stat ="identity")+ylab("Ti/Tv")+scale_y_continuous(breaks =scales::breaks_pretty(3L))+scale_fill_brewer("Ti/Tv", palette ="Set2", na.translate =FALSE)#> `geom_subtile()` subdivide tile into a maximal of 3 rectangles