library(ggalign)
#> Loading required package: ggplot2
#> ========================================
#> ggalign version 1.2.0.9000
#>
#> If you use it in published research, please cite:
#> Peng, Y.; Jiang, S.; Song, Y.; et al. ggalign: Bridging the Grammar of Graphics and Biological Multilayered Complexity. Advanced Science. 2025. doi:10.1002/advs.202507799
#> ========================================ggheatmap()
ggmark()
Annotation observations
By default, when no manual observations were selected, ggmark() will select all observations and split them based on the groups defined in the layout.
set.seed(123)
ggheatmap(mat) +
    anno_right() +
    align_kmeans(3L) +
    ggmark(mark_line()) +
    geom_boxplot(aes(.names, value)) +
    theme(plot.margin = margin(l = 0.1, t = 0.1, unit = "npc"))
#> → heatmap built with `geom_tile()`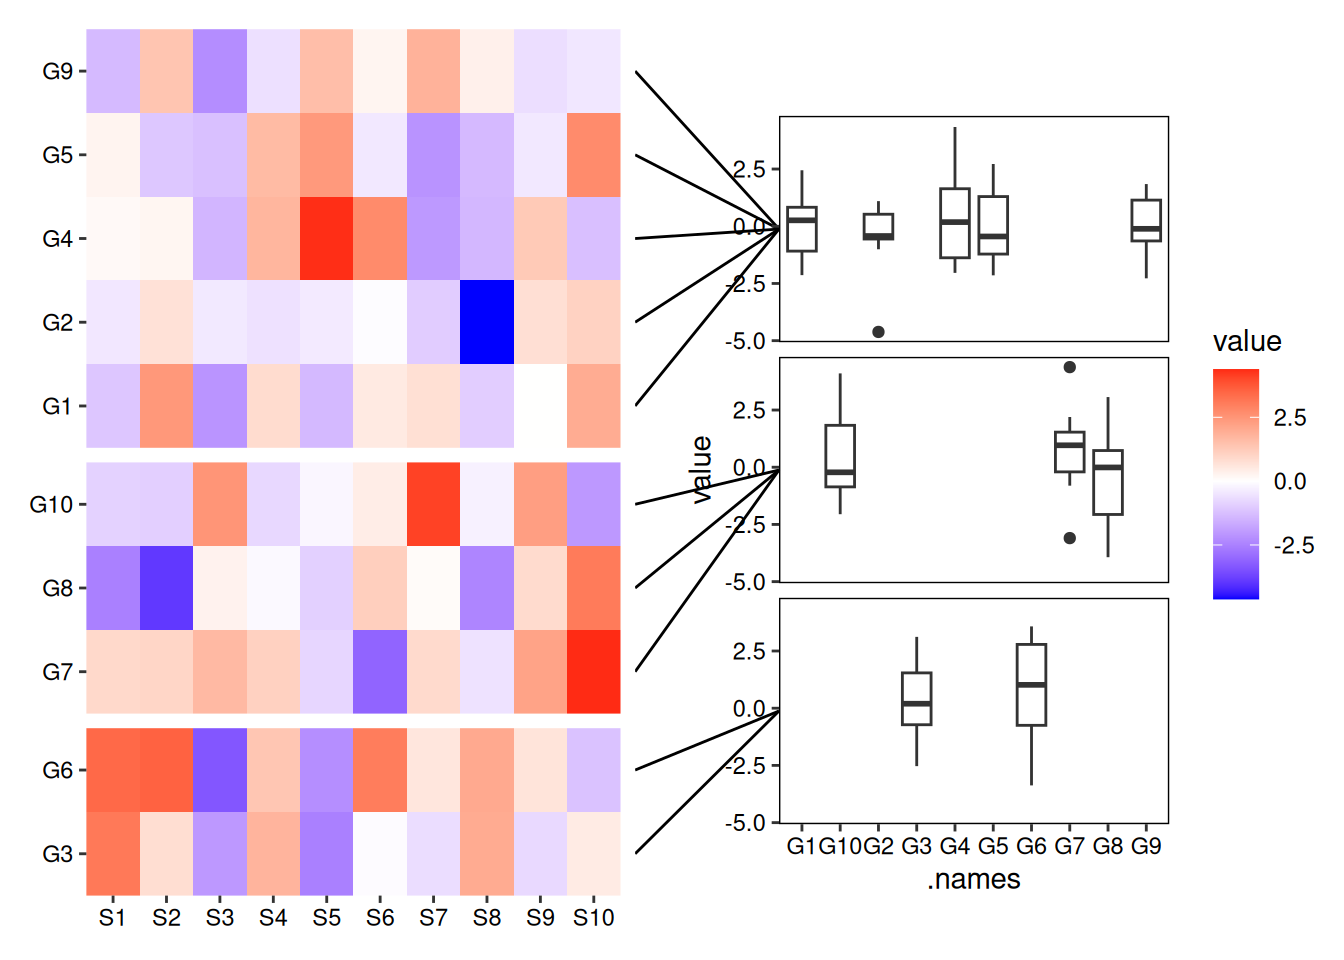
You can also annotate a specific subset of observations. For example, to annotate only rows 1–3 and 6–10:
set.seed(123)
ggheatmap(mat) +
    anno_right() +
    align_kmeans(3L) +
    # Select and annotate rows 1–3 and 6–10 only
    ggmark(mark_line(1:3, 6:10)) +
    geom_boxplot(aes(.names, value)) +
    theme(plot.margin = margin(l = 0.1, t = 0.1, unit = "npc"))
#> → heatmap built with `geom_tile()`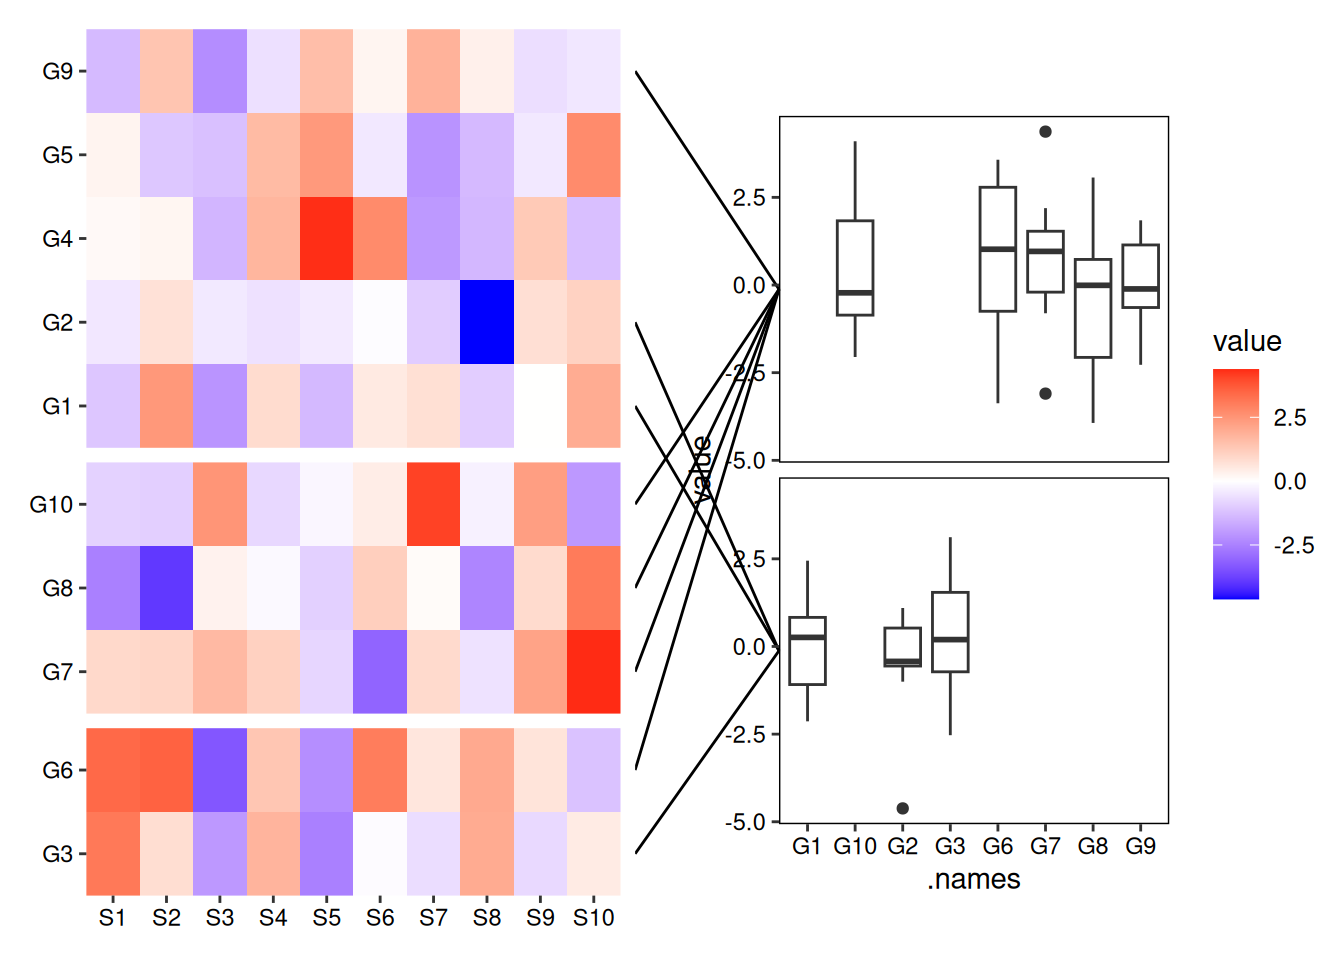
For more details, please visit https://yunuuuu.github.io/ggalign-book/annotate-observations.html
