library(ggalign)
#> Loading required package: ggplot2
#> ========================================
#> ggalign version 1.2.0.9000
#>
#> If you use it in published research, please cite:
#> Peng, Y.; Jiang, S.; Song, Y.; et al. ggalign: Bridging the Grammar of Graphics and Biological Multilayered Complexity. Advanced Science. 2025. doi:10.1002/advs.202507799
#> ========================================stack_cross()
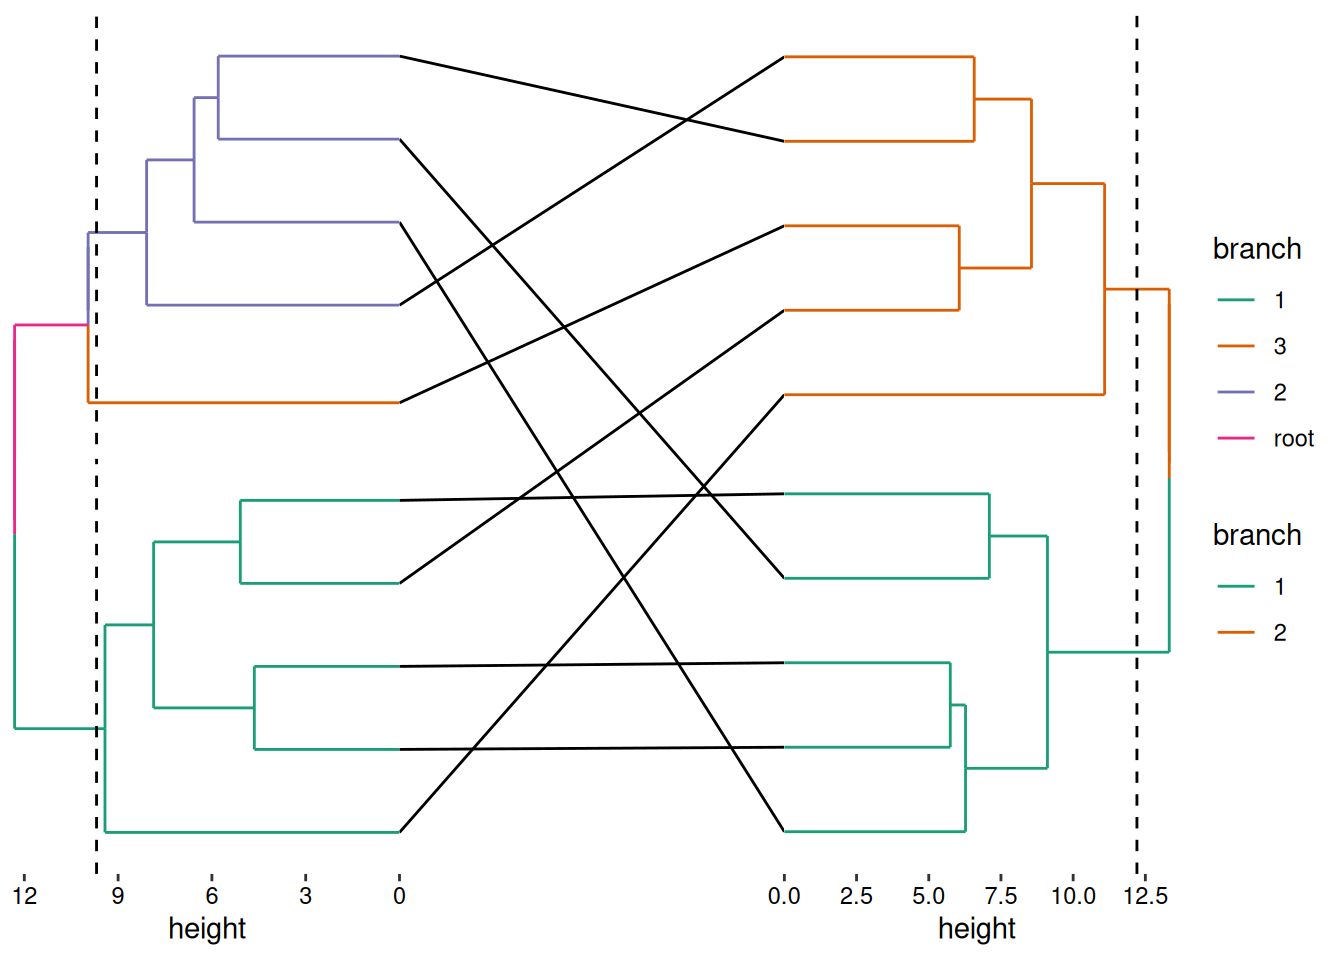
tanglegram
This example demonstrates how to create a tanglegram—a paired visualization of two dendrogram-aligned with cross-links between related elements.
stack_crossh(mat1) +
    align_dendro(aes(color = branch), k = 3L) +
    scale_x_reverse() +
    cross_link(link_line(), data = mat2) +
    align_dendro(aes(color = branch), k = 2L) -
    no_expansion("x") -
    scale_color_brewer(palette = "Dark2") -
    theme(plot.margin = margin())