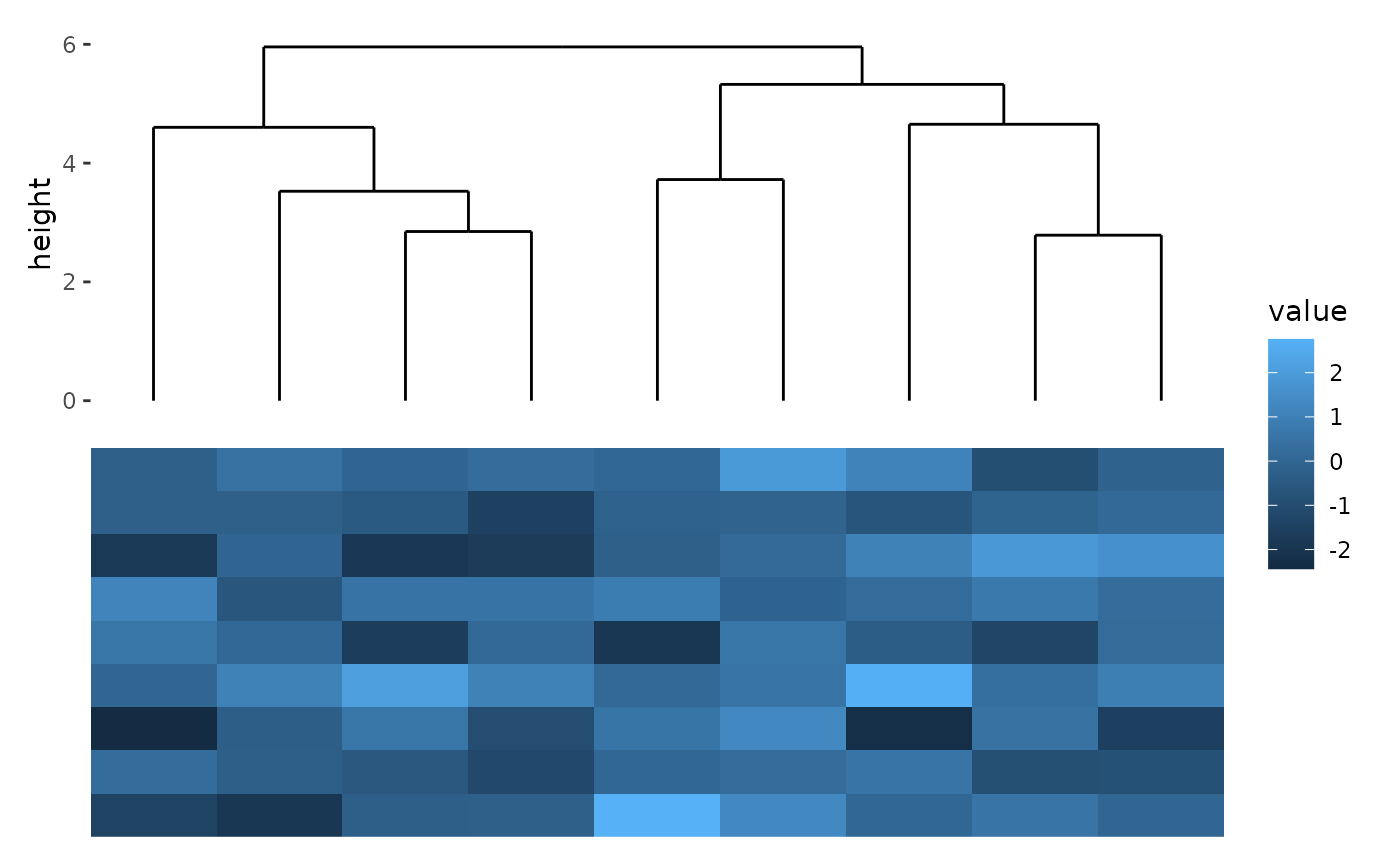
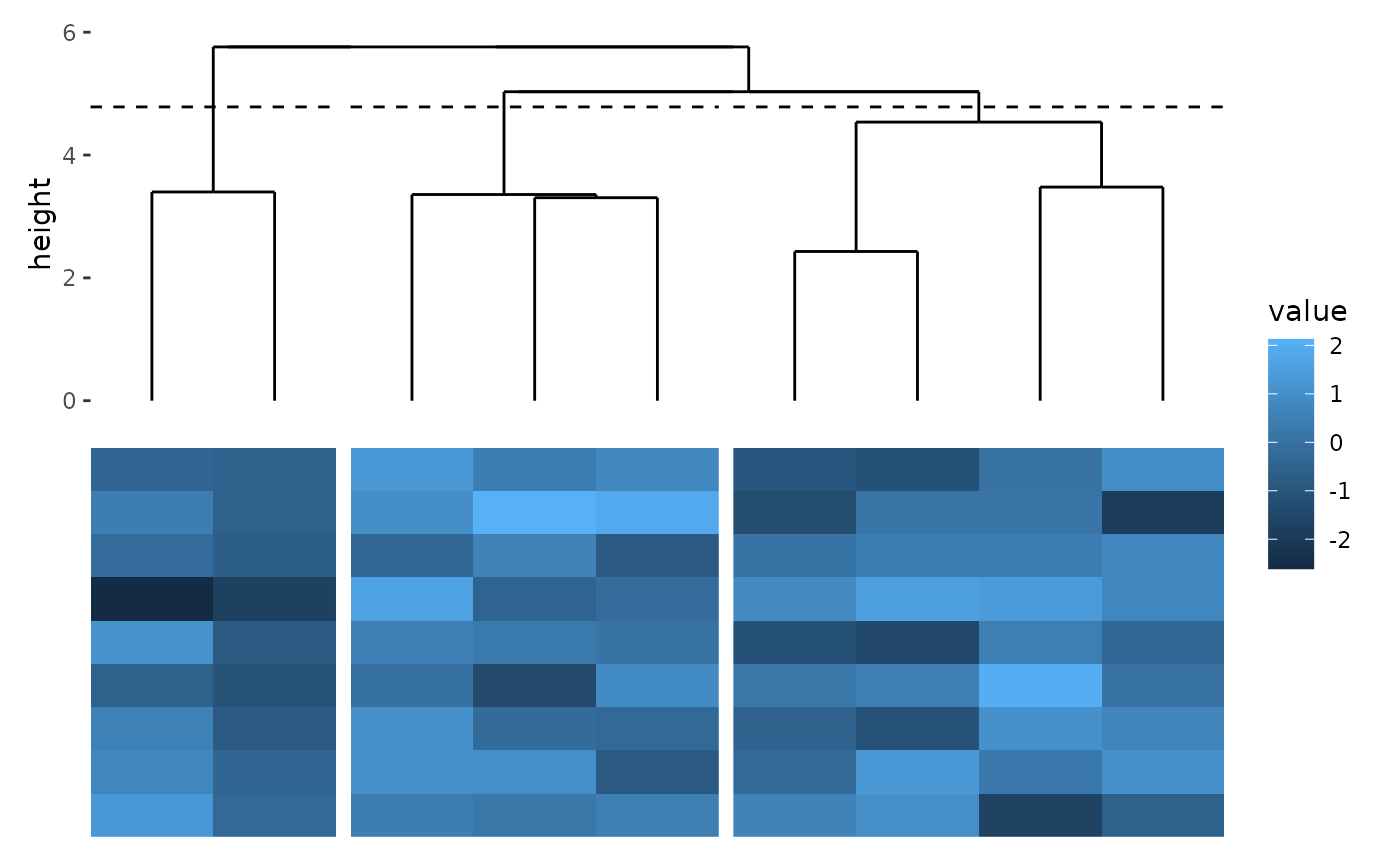
Plot dendrogram tree
Usage
align_dendro(
  mapping = aes(),
  ...,
  distance = "euclidean",
  method = "complete",
  use_missing = "pairwise.complete.obs",
  reorder_dendrogram = FALSE,
  merge_dendrogram = FALSE,
  reorder_group = FALSE,
  k = NULL,
  h = NULL,
  cutree = NULL,
  plot_dendrogram = TRUE,
  plot_cut_height = NULL,
  center = FALSE,
  type = "rectangle",
  root = NULL,
  size = NULL,
  data = NULL,
  active = NULL,
  no_axes = deprecated()
)
Arguments
- mapping
Default list of aesthetic mappings to use for plot. If not specified, must be supplied in each layer added to the plot.
- ...
<dyn-dots> Additional arguments passed to
geom_segment().- distance
A string of distance measure to be used. This must be one of
"euclidean","maximum","manhattan","canberra","binary"or"minkowski". Correlation coefficient can be also used, including"pearson","spearman"or"kendall". In this way,1 - corwill be used as the distance. In addition, you can also provide adistobject directly or a function return adistobject. UseNULL, if you don't want to calculate the distance.- method
A string of the agglomeration method to be used. This should be (an unambiguous abbreviation of) one of
"ward.D","ward.D2","single","complete","average"(= UPGMA),"mcquitty"(= WPGMA),"median"(= WPGMC) or"centroid"(= UPGMC). You can also provide a function which accepts the calculated distance (or the input matrix ifdistanceisNULL) and returns ahclustobject. Alternative, you can supply an object which can be coerced tohclust.- use_missing
An optional character string giving a method for computing covariances in the presence of missing values. This must be (an abbreviation of) one of the strings
"everything","all.obs","complete.obs","na.or.complete", or"pairwise.complete.obs". Only used whendistanceis a correlation coefficient string.- reorder_dendrogram
A single boolean value indicating whether to reorder the dendrogram based on the means. Alternatively, you can provide a custom function that accepts an
hclustobject and the data used to generate the tree, returning either anhclustordendrogramobject. Default isFALSE.- merge_dendrogram
A single boolean value, indicates whether we should merge multiple dendrograms, only used when previous groups have been established. Default:
FALSE.- reorder_group
A single boolean value, indicates whether we should do Hierarchical Clustering between groups, only used when previous groups have been established. Default:
FALSE.- k
An integer scalar indicates the desired number of groups.
- h
A numeric scalar indicates heights where the tree should be cut.
- cutree
A function used to cut the
hclusttree. It should accept four arguments: thehclusttree object,distance(only applicable whenmethodis a string or a function for performing hierarchical clustering),k(the number of clusters), andh(the height at which to cut the tree). By default,cutree()is used.- plot_dendrogram
A boolean value indicates whether plot the dendrogram tree.
- plot_cut_height
A boolean value indicates whether plot the cut height.
- center
A boolean value. if
TRUE, nodes are plotted centered with respect to all leaves/tips in the branch. Otherwise (default), plot them in the middle of the direct child nodes.- type
A string indicates the plot type,
"rectangle"or"triangle".- root
A length one string or numeric indicates the root branch.
- size
The relative size of the plot, can be specified as a
unit(). Note that forcircle_layout(), all size values will be interpreted as relative sizes, as this layout type adjusts based on the available space in the circular arrangement.- data
A matrix-like object. By default, it inherits from the layout
matrix.- active
A
active()object that defines the context settings when added to a layout.- no_axes
![[Deprecated]](figures/lifecycle-deprecated.svg) Please add
Please add
theme()directly to the ggplot instead.
ggplot2 specification
align_dendro initializes a ggplot data and mapping.
The internal ggplot object will always use a default mapping of
aes(x = .data$x, y = .data$y).
The default ggplot data is the node coordinates with edge data attached
in ggalign attribute, in addition, a
geom_segment layer with a data frame of the edge
coordinates will be added when plot_dendrogram = TRUE.
See fortify_data_frame.dendrogram() for details.