ggheatmap()
Heatmap with Annotations
Annotate top with color bars:
ggheatmap(mat) +
    anno_top(size = unit(1, "cm")) +
    align_kmeans(centers = 3L) +
    ggalign(data = NULL) +
    geom_tile(aes(y = 1L, fill = .panel, color = .panel)) +
    theme_no_axes("y")
#> → heatmap built with `geom_tile()`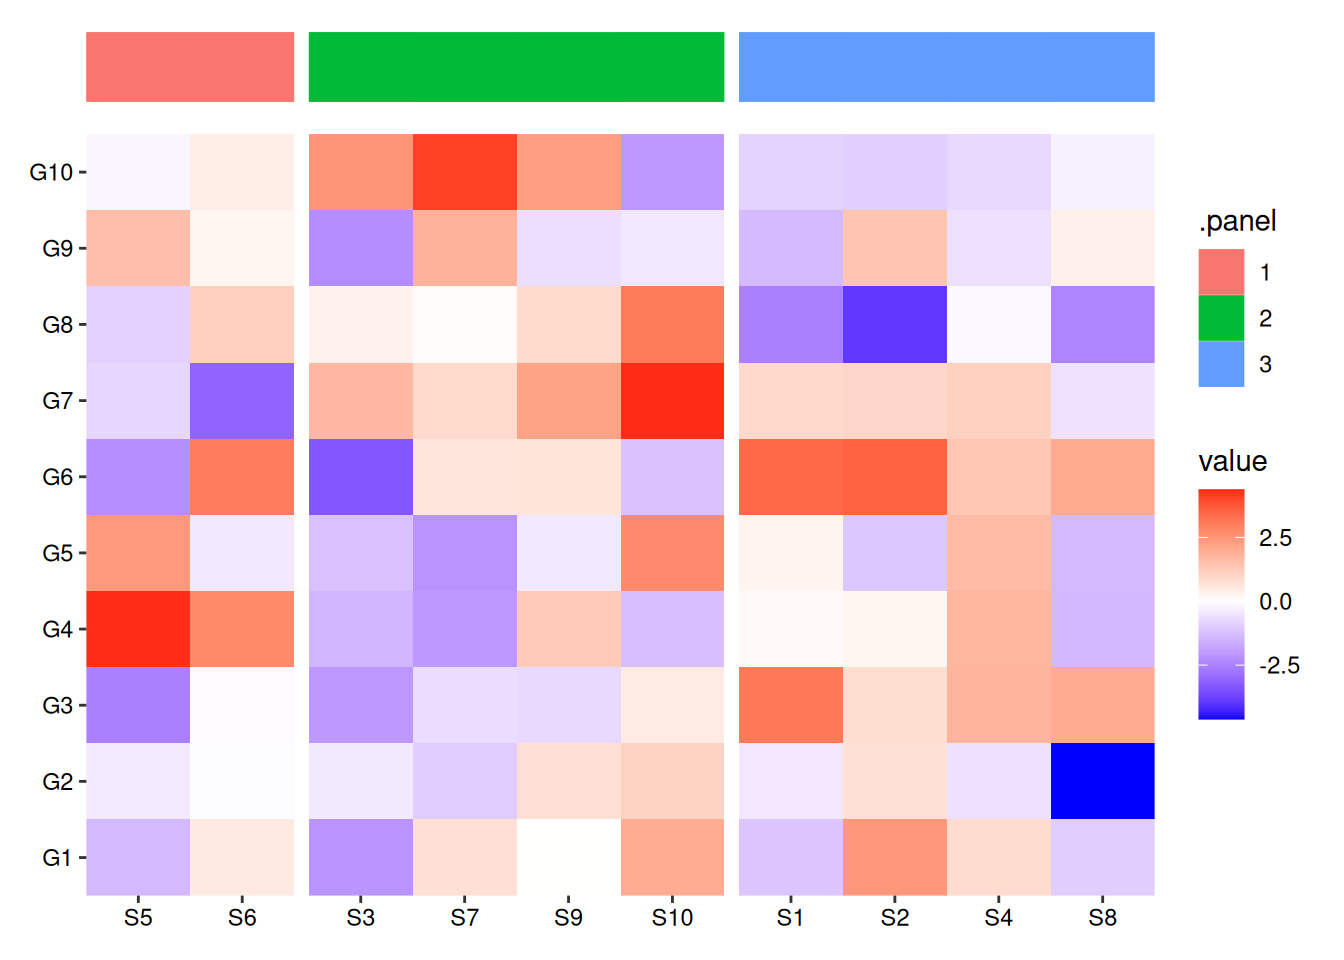
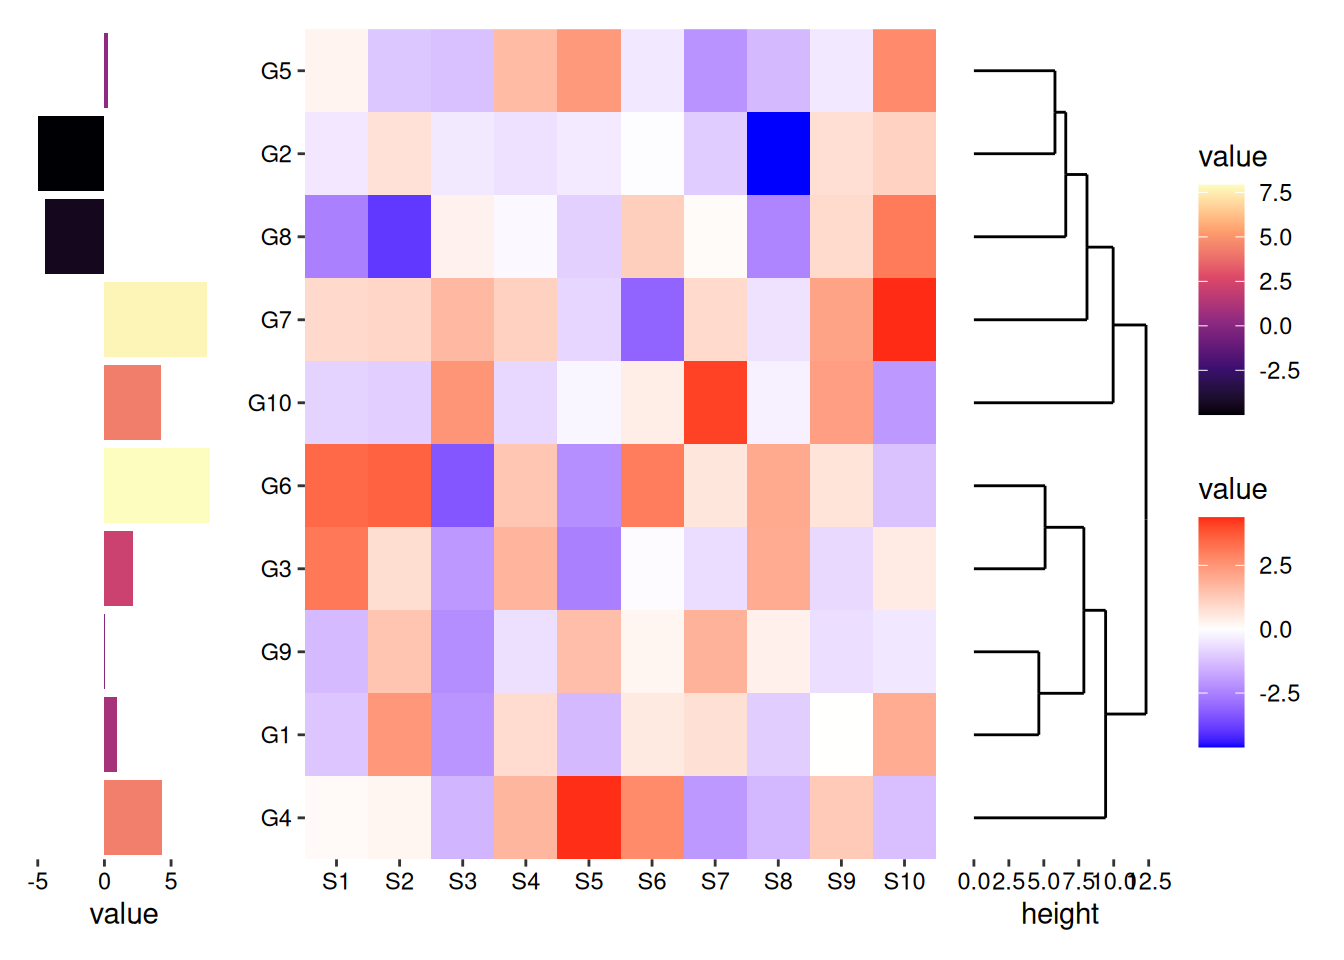
Annotate both left and right positions:
ggheatmap(mat) +
    anno_right(size = 0.3) +
    align_dendro() +
    anno_left(size = 0.3) +
    ggalign(rowSums) +
    geom_bar(aes(x = value, y = .y, fill = value),
        orientation = "y", stat = "identity"
    ) +
    scale_fill_viridis_c(option = "A")
#> → heatmap built with `geom_tile()`