library(ggalign)
#> Loading required package: ggplot2
#> ========================================
#> ggalign version 1.2.0.9000
#>
#> If you use it in published research, please cite:
#> Peng, Y.; Jiang, S.; Song, Y.; et al. ggalign: Bridging the Grammar of Graphics and Biological Multilayered Complexity. Advanced Science. 2025. doi:10.1002/advs.202507799
#> ========================================ggheatmap()
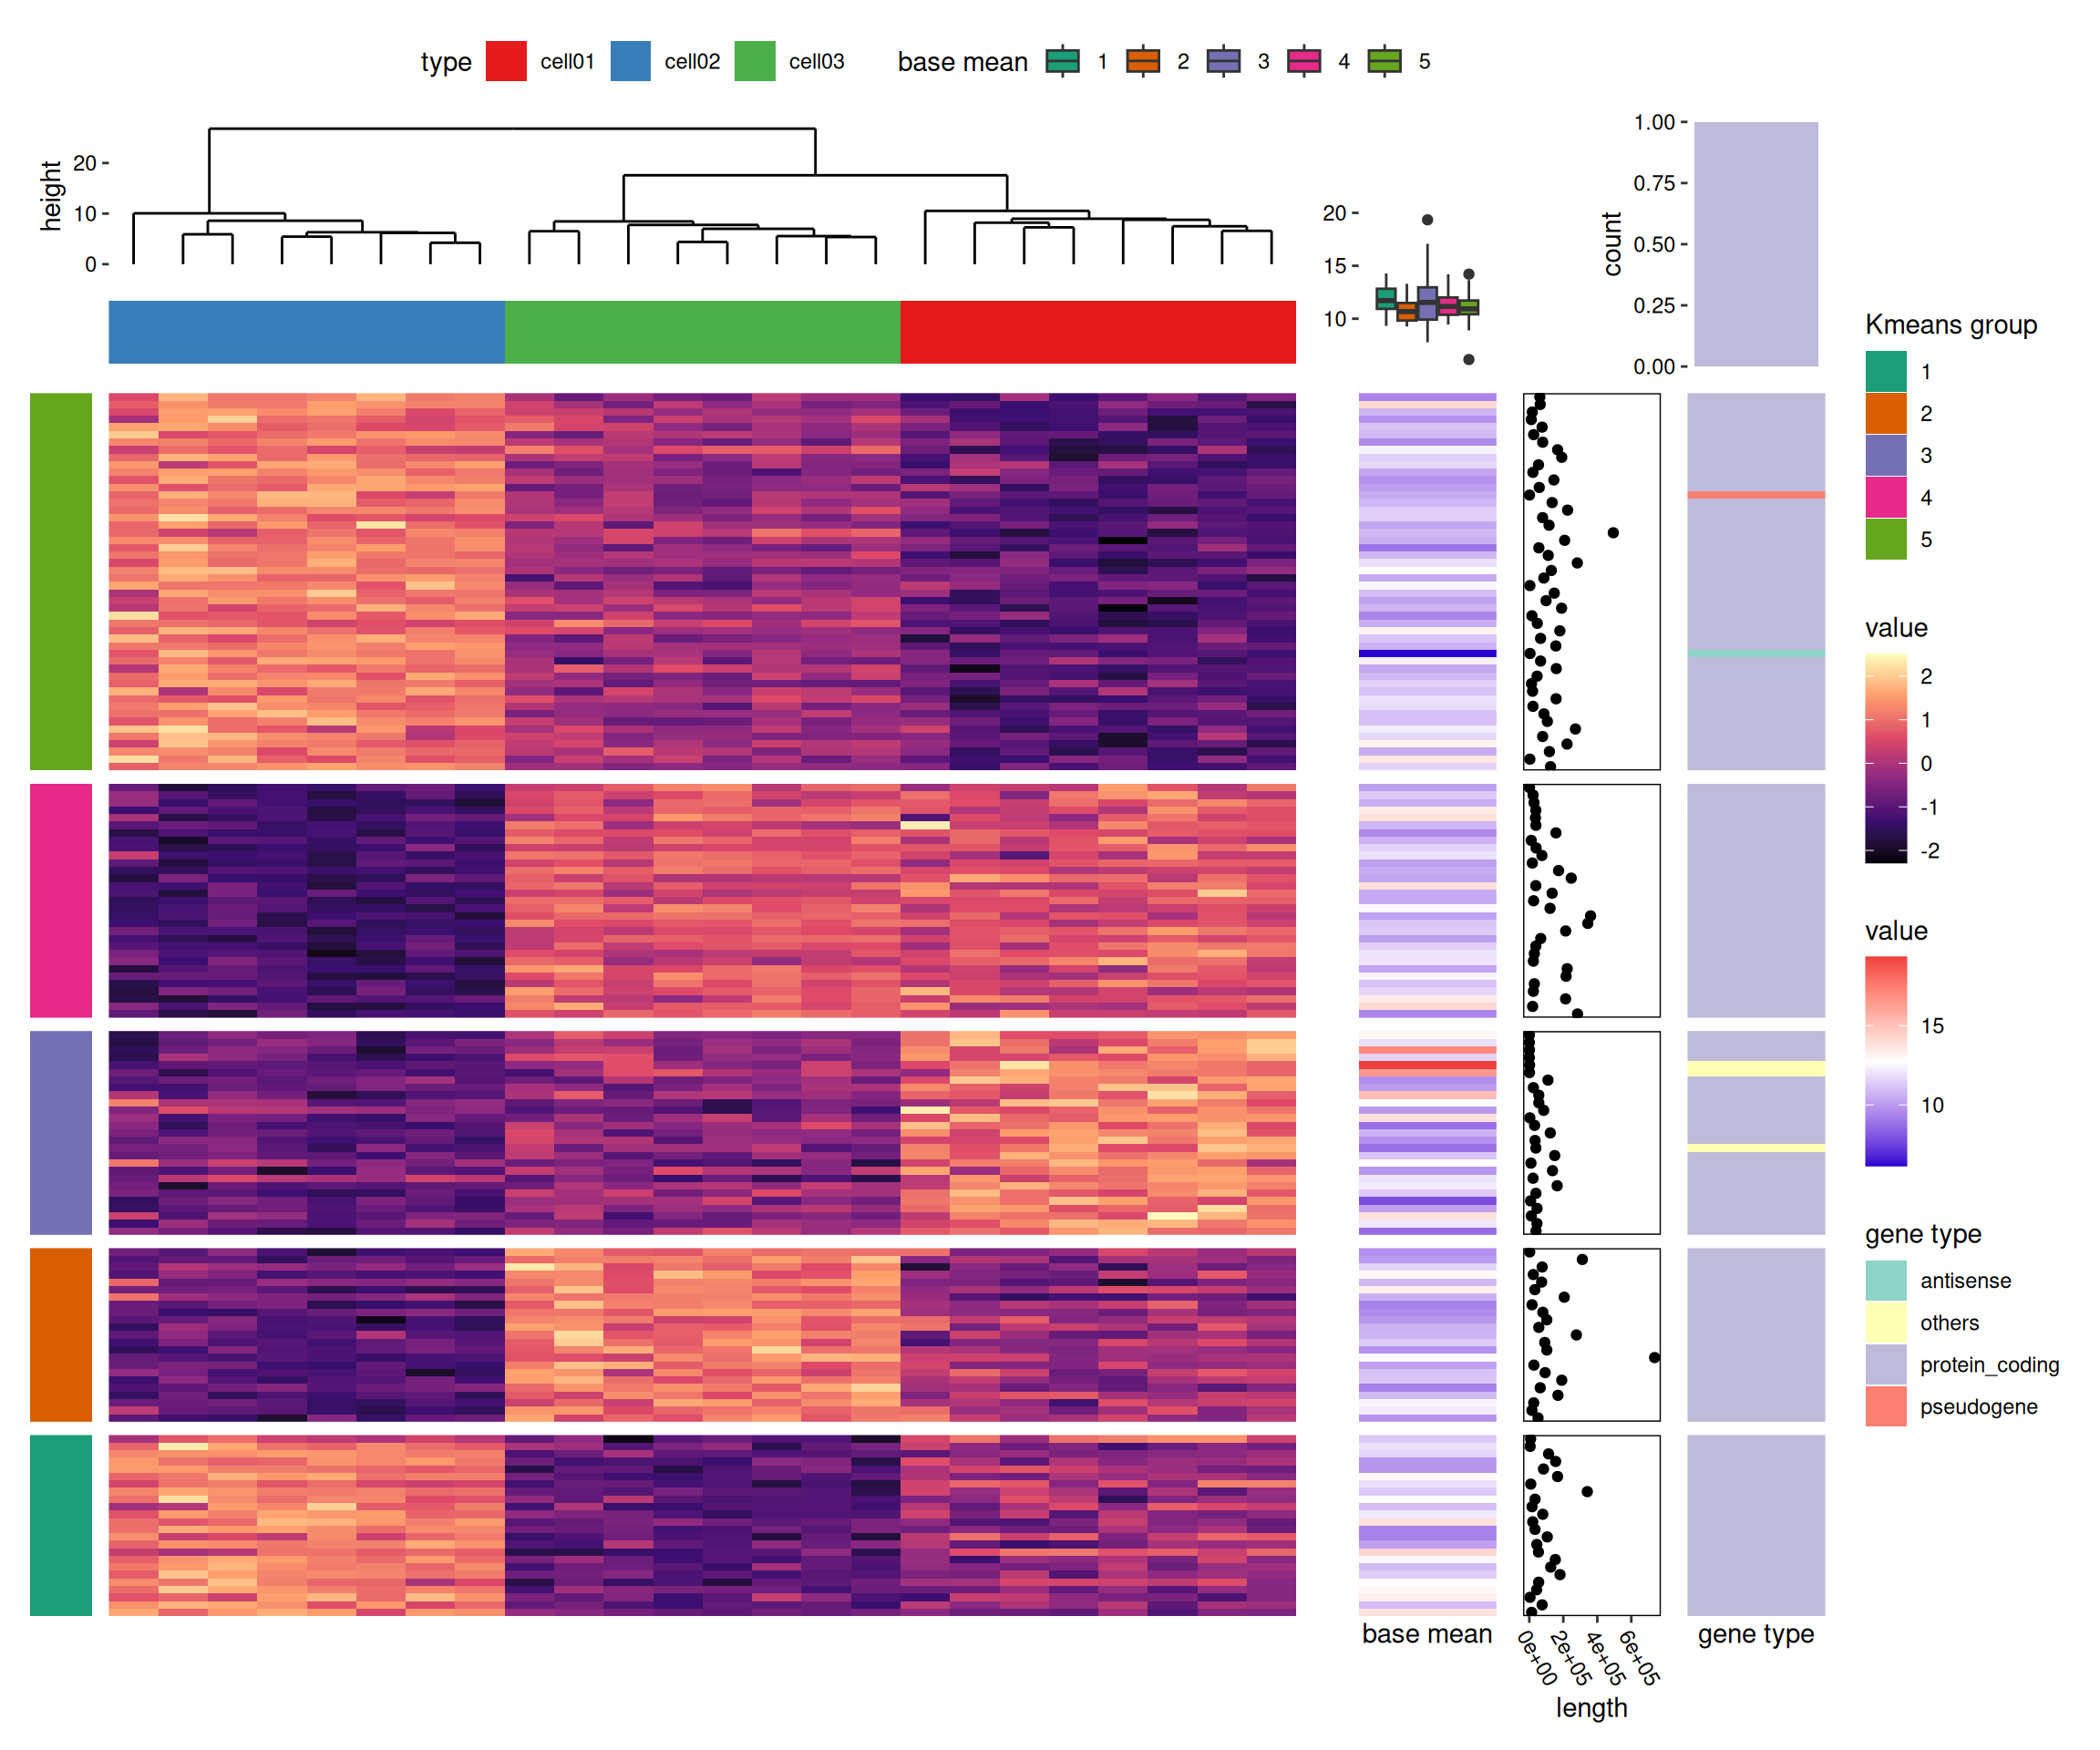
Heatmap of gene expression matrix
We utilize the gene expression dataset included in the R ComplexHeatmap package to reproduce the multi-panel gene expression heatmap from https://jokergoo.github.io/ComplexHeatmap-reference/book/more-examples.html.
We load the example dataset from ComplexHeatmap and process it for visualization.
heat1 <- ggheatmap(mat_scaled) -
    scheme_align(free_spaces = "l") +
    scale_y_continuous(breaks = NULL) +
    scale_fill_viridis_c(option = "magma") +
    # add dendrogram for this heatmap
    anno_top() +
    align_dendro() +
    # add a block for the heatmap column
    ggalign(data = type, size = unit(1, "cm")) +
    geom_tile(aes(y = 1, fill = factor(value))) +
    scale_y_continuous(breaks = NULL, name = NULL) +
    scale_fill_brewer(
        palette = "Set1", name = "type",
        guide = guide_legend(position = "top")
    )

heat2 <- ggheatmap(base_mean, width = unit(2, "cm")) +
    scale_y_continuous(breaks = NULL) +
    scale_x_continuous(name = "base mean", breaks = FALSE) +
    scale_fill_gradientn(colours = c("#2600D1FF", "white", "#EE3F3FFF")) +
    # set the active context of the heatmap to the top
    # and set the size of the top stack
    anno_top(size = unit(4, "cm")) +
    # add box plot in the heatmap top
    ggalign() +
    geom_boxplot(aes(y = value, fill = factor(.extra_panel))) +
    scale_x_continuous(expand = expansion(), breaks = NULL) +
    scale_fill_brewer(
        palette = "Dark2", name = "base mean",
        guide = guide_legend(position = "top")
    ) +
    theme(axis.title.y = element_blank())

heat3 <- ggheatmap(expr$type, width = unit(2, "cm")) +
    scale_fill_brewer(palette = "Set3", name = "gene type") +
    scale_x_continuous(breaks = NULL, name = "gene type") +
    # add barplot in the top annotation, and remove the spaces in the y-axis
    anno_top() -
    scheme_align(free_spaces = "lr") +
    ggalign() +
    geom_bar(
        aes(.extra_panel, fill = factor(value)),
        position = position_fill()
    ) +
    scale_y_continuous(expand = expansion()) +
    scale_fill_brewer(palette = "Set3", name = "gene type", guide = "none") -
    scheme_theme(plot.margin = margin())

stack_alignh(mat_scaled) +
    stack_active(sizes = c(0.2, 1, 1)) +
    # group stack rows into 5 groups
    align_kmeans(centers = 5L) +
    # add a block plot for each group in the stack
    ggalign(size = unit(1, "cm"), data = NULL) +
    geom_tile(aes(x = 1, fill = factor(.panel))) +
    scale_fill_brewer(palette = "Dark2", name = "Kmeans group") +
    scale_x_continuous(breaks = NULL, name = NULL) +
    # add a heatmap plot in the stack
    heat1 +
    # add another heatmap in the stack
    heat2 +
    # we move into the stack layout
    stack_active() +
    # add a point plot
    ggalign(data = expr$length, size = unit(2, "cm")) +
    geom_point(aes(x = value)) +
    labs(x = "length") +
    theme(
        panel.border = element_rect(fill = NA),
        axis.text.x = element_text(angle = -60, hjust = 0)
    ) +
    # add another heatmap
    heat3 &
    theme(
        plot.background = element_blank(),
        panel.background = element_blank(),
        legend.background = element_blank()
    )
#> → heatmap built with `geom_tile()`
#> → heatmap built with `geom_tile()`
#> → heatmap built with `geom_tile()`