The ggalign package extends ggplot2 to simplify the creation of complex, multi-plot visualizations. Built on the familiar grammar of graphics, it provides intuitive tools to align and organize plots—such as heatmaps, dendrograms, or circular layouts—while handling intricate relationships in multi-omics data, like genomics or microbiomes. Whether you need to stack plots, arrange them around a central figure, or link diverse datasets (e.g., genes to pathways), ggalign offers flexibility and precision with minimal effort.
Why use ggalign?
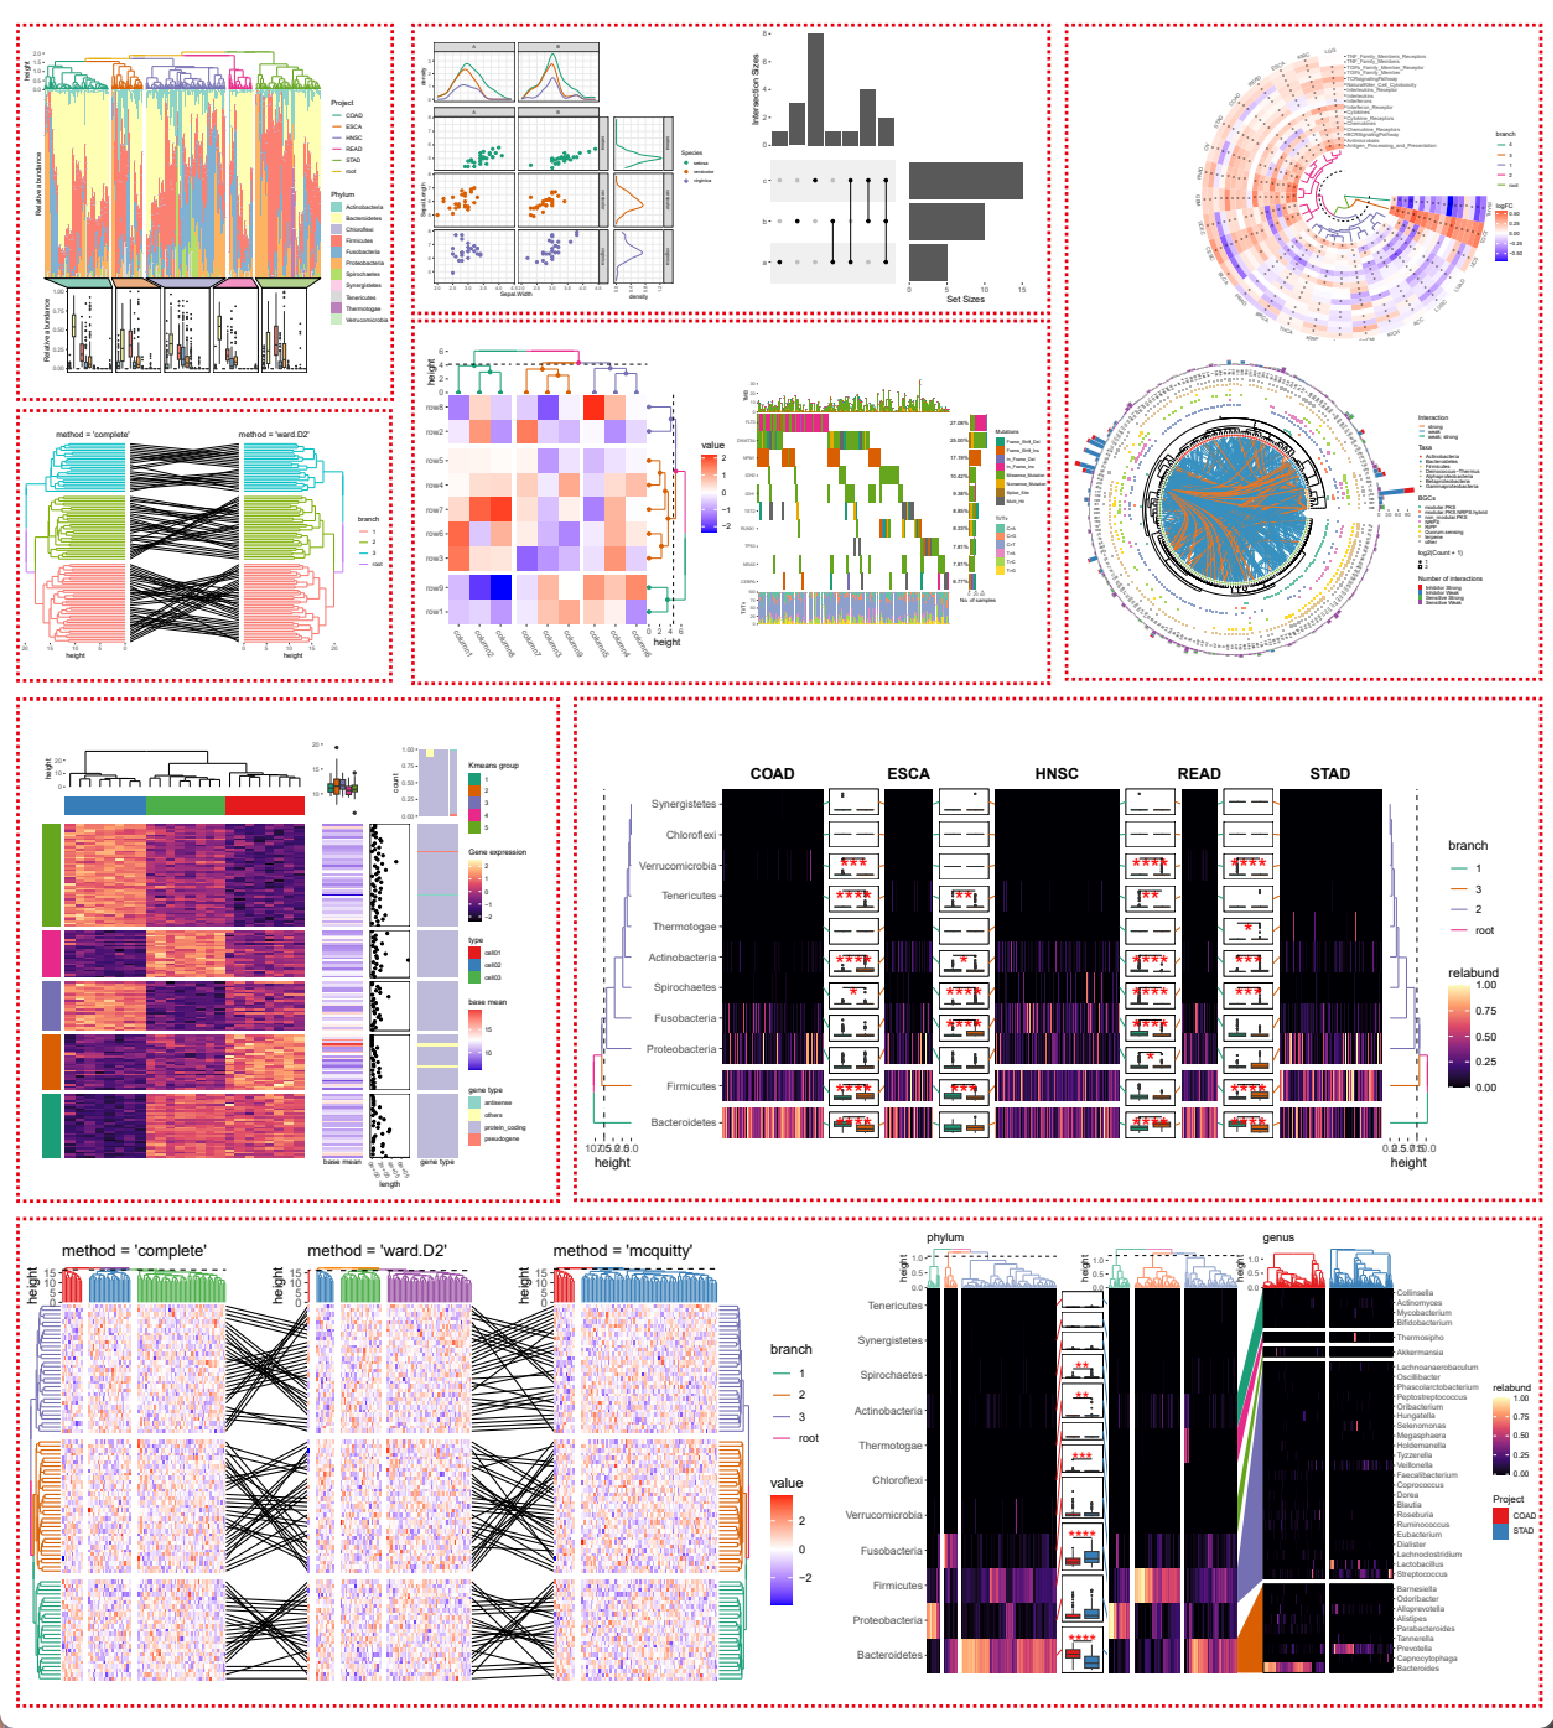
ggalign focuses on aligning observations across multiple plots. If you’ve ever struggled with aligning plots with self-contained ordering (like dendrogram), or applying consistent grouping or ordering across multiple plots (e.g., with k-means clustering), ggalign is designed to make this easier. The package integrates seamlessly with ggplot2, providing the flexibility to use its geoms, scales, and other components for complex visualizations.
Installation
You can install ggalign from CRAN using:
install.packages("ggalign")Alternatively, install the development version from r-universe with:
install.packages("ggalign",
    repos = c("https://yunuuuu.r-universe.dev", "https://cloud.r-project.org")
)
or from GitHub with:
# install.packages("remotes")
remotes::install_github("Yunuuuu/ggalign")
Learning ggalign
The complete tutorial is available at: https://yunuuuu.github.io/ggalign-book/
For the full reference documentation, visit: https://yunuuuu.github.io/ggalign/
Compare with other similar tools
ggalign
|
marsilea
|
ComplexHeatmap
|
||
|---|---|---|---|---|
| Language | R | Python | R | |
| User Interface | Declarative | Declarative | Functional | |
| Plot System | ggplot2 (Advanced plot system built on grid system) | Matplotlib | grid | |
| Focus | Composable Visualization | Composable Visualization | Heatmap | |
| StackLayout | ✅ | ✅ | ✅ | |
| QuadLayout | ✅ | ✅ | Heatmap Only (discrete variables) | |
| CircleLayout | ✅ | ❌ | ❌ | |
| Relationship | One-to-One | ✅ | ✅ | ✅ |
| One-to-Many/Many-to-One | ✅ | ❌ | ❌ | |
| Many-to-Many | ✅ | ❌ | ❌ | |
| Crosswise | ✅ | ❌ | ❌ | |
| Annotate observations | ✅ | ❌ | ✅ | |
| Fully Compatible with ggplot2 | ✅ | ❌ | ❌ | |
Comparison of specifications with other similar tools
| Specification | ggalign |
marsilea |
ComplexHeatmap |
|---|---|---|---|
| Reorder observations | ✅ | ✅ | Heatmap Only |
| Group observations into different panels | ✅ | ✅ | Heatmap Only |
| Clustering algorithm | Kmeans,Hierarchical Clustering and arbitary algorithm | ❌ | Kmeans,Hierarchical Clustering and arbitary algorithm |
| Legends Creation | Automatic | Automatic | Limited automatic, requires manual add |
| Legends Position | Anywhere, can be controlled for a single plot | Anywhere | Four sides, can only be placed on one side at a time |
| Dendrogram | Tree from both hclust or ape
|
hclust only |
hclust only |
| Tanglegram | ✅ | ❌ | ❌ |
| 3D Heatmap | ✅ | ❌ | ✅ |
| Oncoplot | ✅ | ✅ | ✅ |
| UpSet plot | ✅ | ✅ | ✅ |
Acknowledgements
I would like to express my sincere gratitude to the contributors of the ggplot2 project for providing a powerful and flexible framework for data visualization in R. Their work laid the foundation for the functionality and design of this package. I would also like to thank the patchwork project, from which the core coding for the plot composer was adapted. The patchwork library provided a useful mechanism for combining and aligning plots, which was modified to suit the needs of this package. Without the contributions of these open-source projects, this package would not have been possible.
Additionally, I would like to extend my heartfelt thanks to @teunbrand, who has fulfilled my numerous feature requests, and assisted with the integration of new functions into ggplot2.