Arrange multiple plots into a grid
Usage
align_plots(
  ...,
  ncol = NULL,
  nrow = NULL,
  byrow = TRUE,
  widths = NA,
  heights = NA,
  design = NULL,
  guides = waiver(),
  theme = NULL
)
Arguments
- ...
<dyn-dots> A list of plots, ususally the ggplot object. Use
NULLto indicate an empty spacer.- ncol, nrow
The dimensions of the grid to create - if both are
NULLit will use the same logic asfacet_wrap()to set the dimensions- byrow
If
FALSEthe plots will be filled in in column-major order.- widths, heights
The relative widths and heights of each column and row in the grid. Will get repeated to match the dimensions of the grid. The special value of
NAwill behave as1nullunit unless a fixed aspect plot is inserted in which case it will allow the dimension to expand or contract to match the aspect ratio of the content.- design
Specification of the location of areas in the layout. Can either be specified as a text string or by concatenating calls to
area()together.- guides
A string with one or more of
"t","l","b","r", and"i"indicating which side of guide legends should be collected. Defaults towaiver(), which inherits from the parent layout. If there is no parent layout, or ifNULLis provided, no guides will be collected.- theme
A
theme()object used to customize various elements of the plot, includingguides,title,subtitle,caption,margins,panel.border, andbackground. By default, the theme will inherit from the parentlayout.
Examples
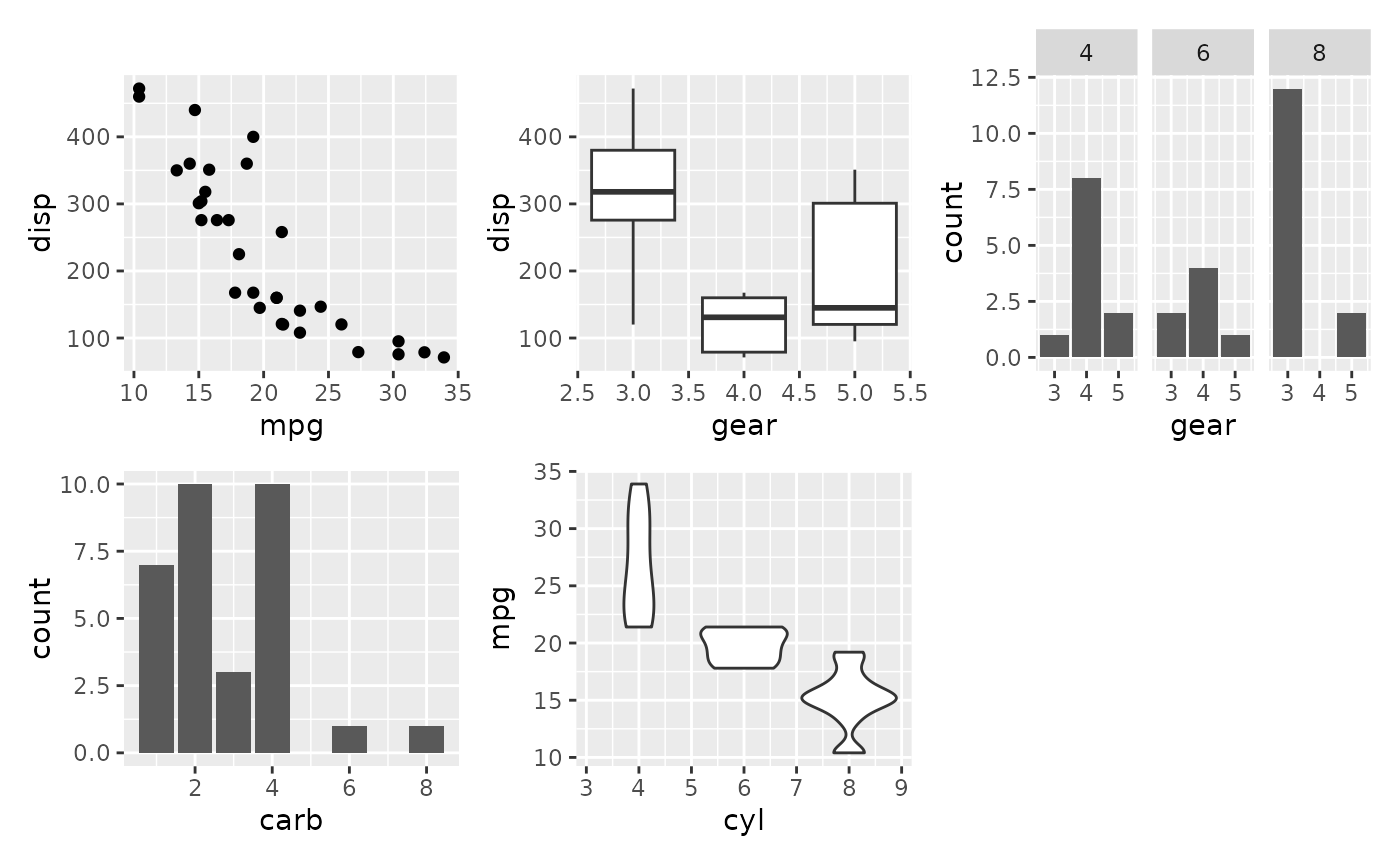
# directly copied from patchwork
p1 <- ggplot(mtcars) +
    geom_point(aes(mpg, disp))
p2 <- ggplot(mtcars) +
    geom_boxplot(aes(gear, disp, group = gear))
p3 <- ggplot(mtcars) +
    geom_bar(aes(gear)) +
    facet_wrap(~cyl)
p4 <- ggplot(mtcars) +
    geom_bar(aes(carb))
p5 <- ggplot(mtcars) +
    geom_violin(aes(cyl, mpg, group = cyl))

# Either add the plots as single arguments
align_plots(p1, p2, p3, p4, p5)


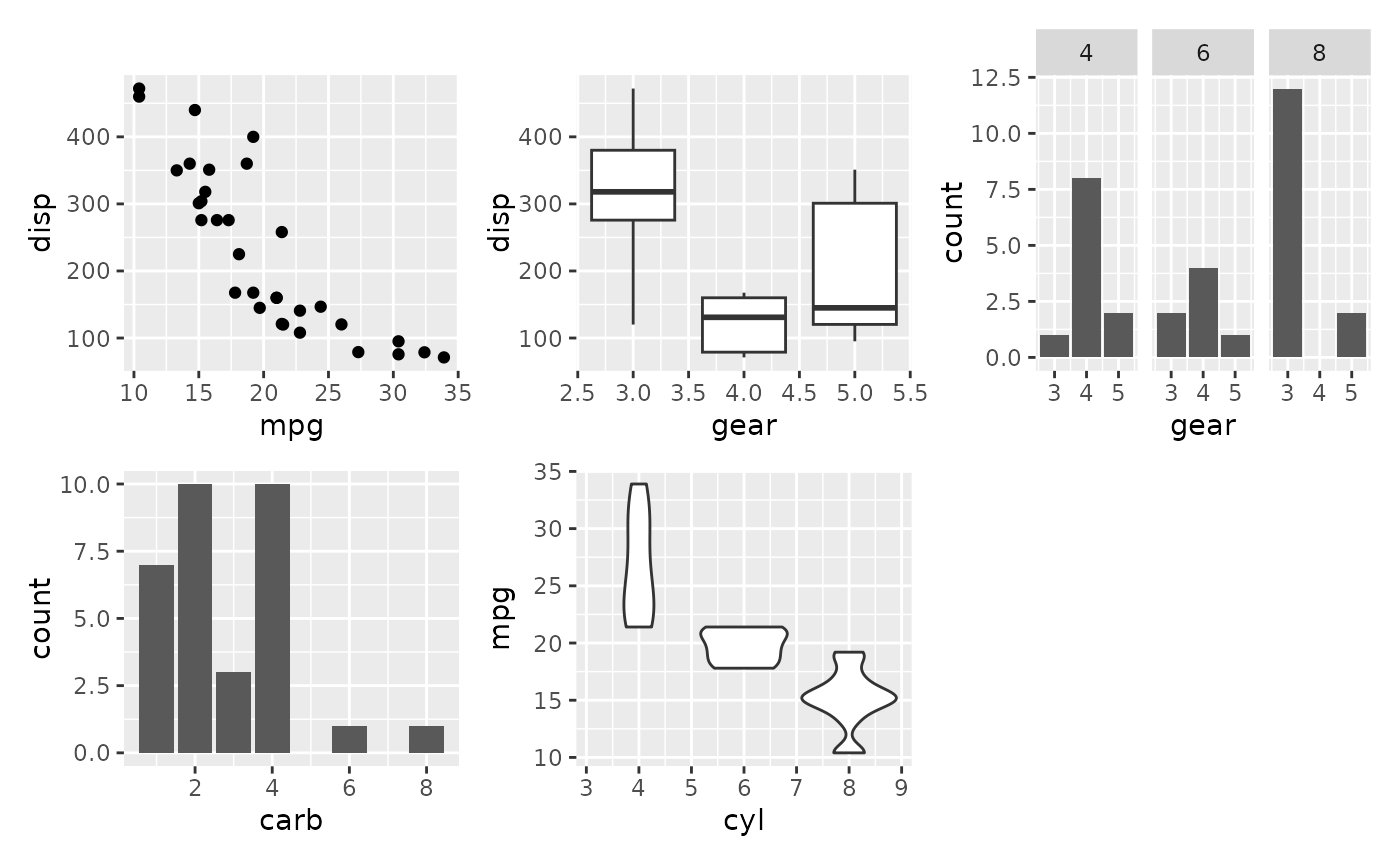
# Or use bang-bang-bang to add a list
align_plots(!!!list(p1, p2, p3), p4, p5)


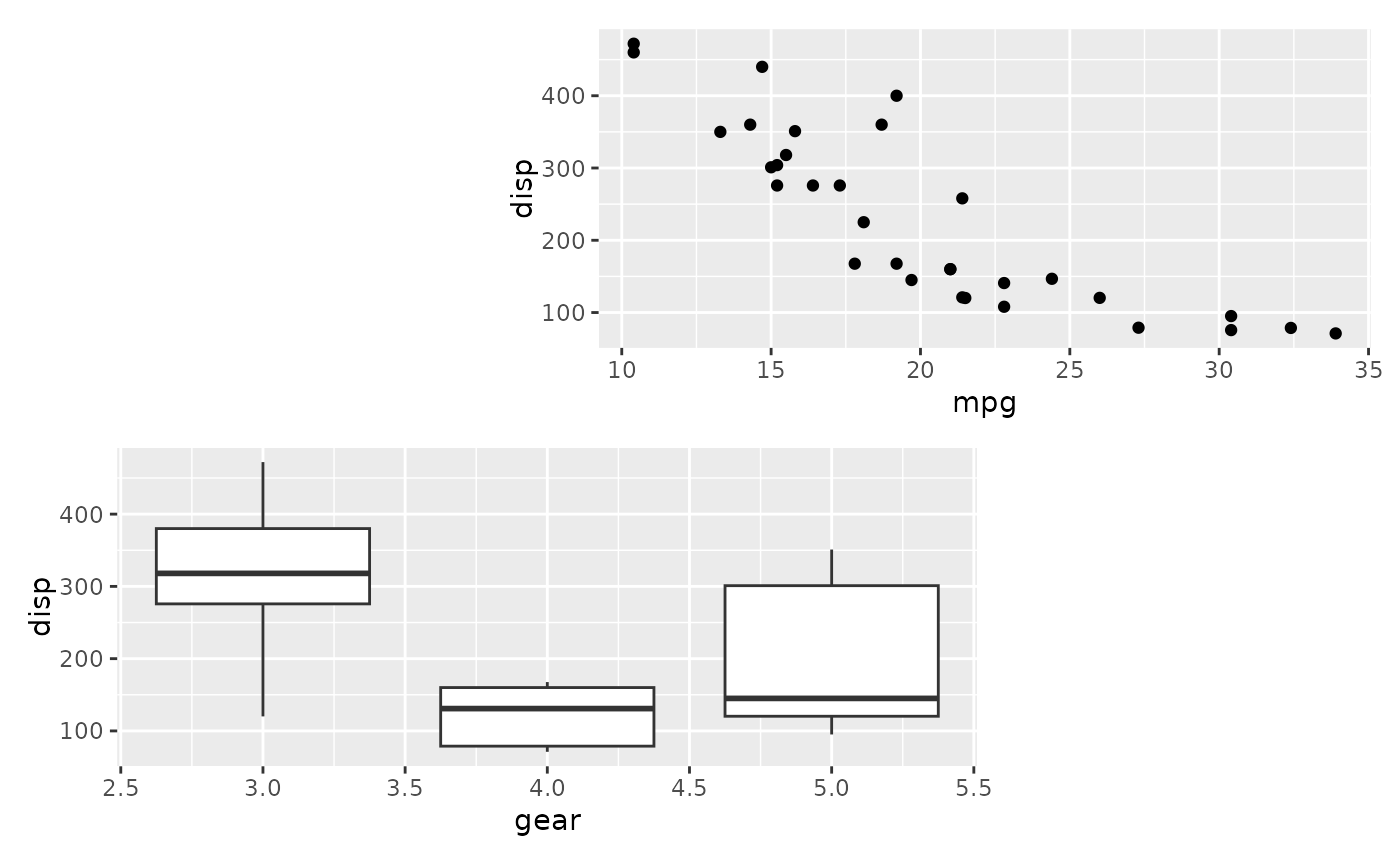
# Match plots to areas by name
design <- "#BB
           AA#"
align_plots(B = p1, A = p2, design = design)


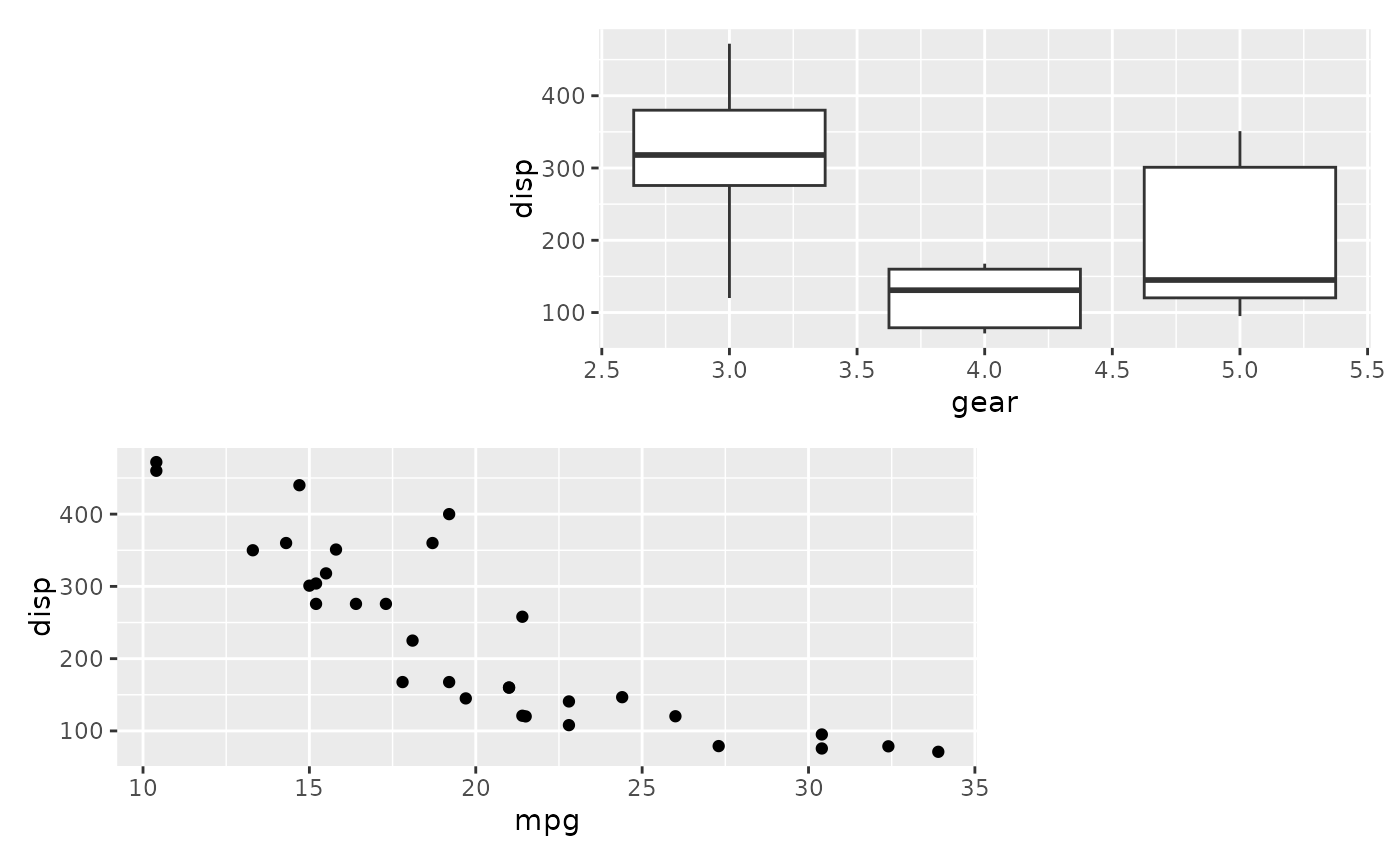
# Compare to not using named plot arguments
align_plots(p1, p2, design = design)

