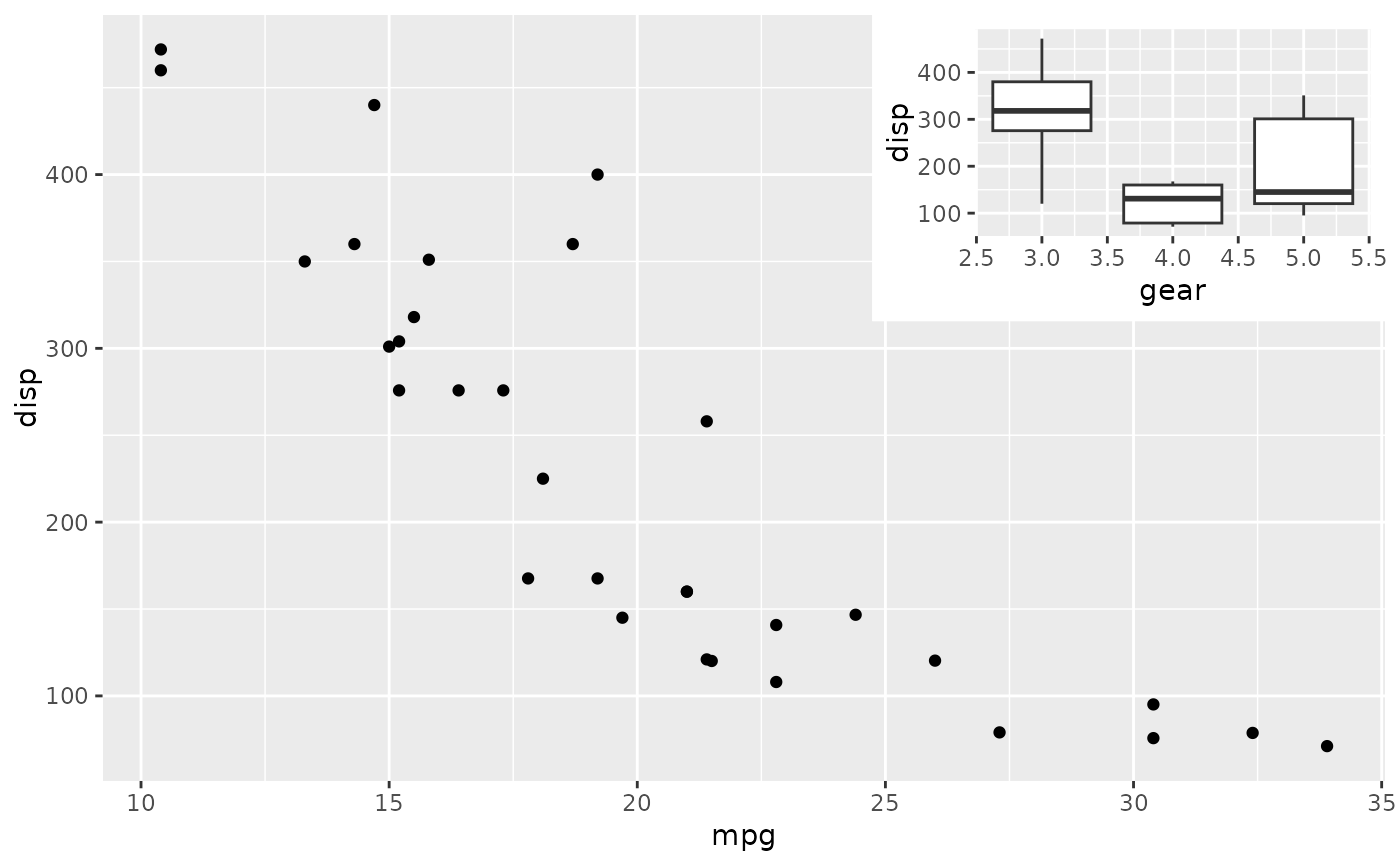
Create a ggplot inset
Arguments
- plot
Any graphic that can be converted into a
grobusingpatch().- ...
Additional arguments passed to the
patch()method.- align
A string specifying the area to place the plot:
"full"for the full area,"plot"for the full plotting area (including the axis label), or"panel"for only the actual area where data is drawn.- on_top
A single boolean value indicates whether the graphic plot should be put frontmost. Note: the graphic plot will always put above the background.
- clip
A single boolean value indicating whether the grob should be clipped if they expand outside their designated area.
- vp
A
viewportobject, you can use this to define the plot area.

