library(ggalign)
#> Loading required package: ggplot2
#> ========================================
#> ggalign version 1.2.0.9000
#>
#> If you use it in published research, please cite:
#> Peng, Y.; Jiang, S.; Song, Y.; et al. ggalign: Bridging the Grammar of Graphics and Biological Multilayered Complexity. Advanced Science. 2025. doi:10.1002/advs.202507799
#> ========================================
How to arrange ggalign objects with other ggplot2 or grid objects?
align_plots() function can arrange the ggplot2 objects,
and it can also accept objects from ggalign,
ComplexHeatmap, pheatmap directly. It behaves
similar with pathwork::wrap_plots(), but it cannot add tags
(the “A”, “B”, “C”, “D” in the top-left corner) — I prefer to add tags
manually using Inkscape or Illustrator.
If you wish to use other packages to arrange your plots, you can use
the ggalignGrob() function to convert ggalign
objects into a grob. This allows you to arrange them alongside other
plots or annotations using patchwork, cowplot,
or ggpubr. However, note that in this case, the plot panels
of the ggalign Layout object won’t be
aligned with the ggplot2 plot panel.
How to customize the gene ordering in ggoncoplot function?
To manually define the row (gene) and column (sample) order in
ggoncoplot(), you first need to disable the automatic
ordering applied by ggoncoplot(). Then, you can use the
align_order() function to specify the desired
arrangement.
# Sample data
mut_mat <- read.table(
    textConnection(
        "s1,s2,s3
         snv;indel,snv,indel
         ,snv;indel,snv
         snv,,indel;snv"
    ),
    row.names = NULL,
    header = TRUE,
    sep = ",",
    stringsAsFactors = FALSE
)
rownames(mut_mat) <- c("g1", "g2", "g3")
mut_mat <- as.matrix(mut_mat)

# Example 1: Manually order rows using numeric indices
ggoncoplot(
    mut_mat,
    map_width = c(snv = 0.5),
    map_height = c(indel = 0.9),
    reorder_row = FALSE
) +
    scale_fill_brewer(palette = "Dark2", na.translate = FALSE) +
    # Use anno_left() or anno_right() for row ordering; for columns, use anno_top() or anno_bottom()
    anno_left() +
    align_order(c(2, 3, 1)) # Orders rows as g2, g3, g1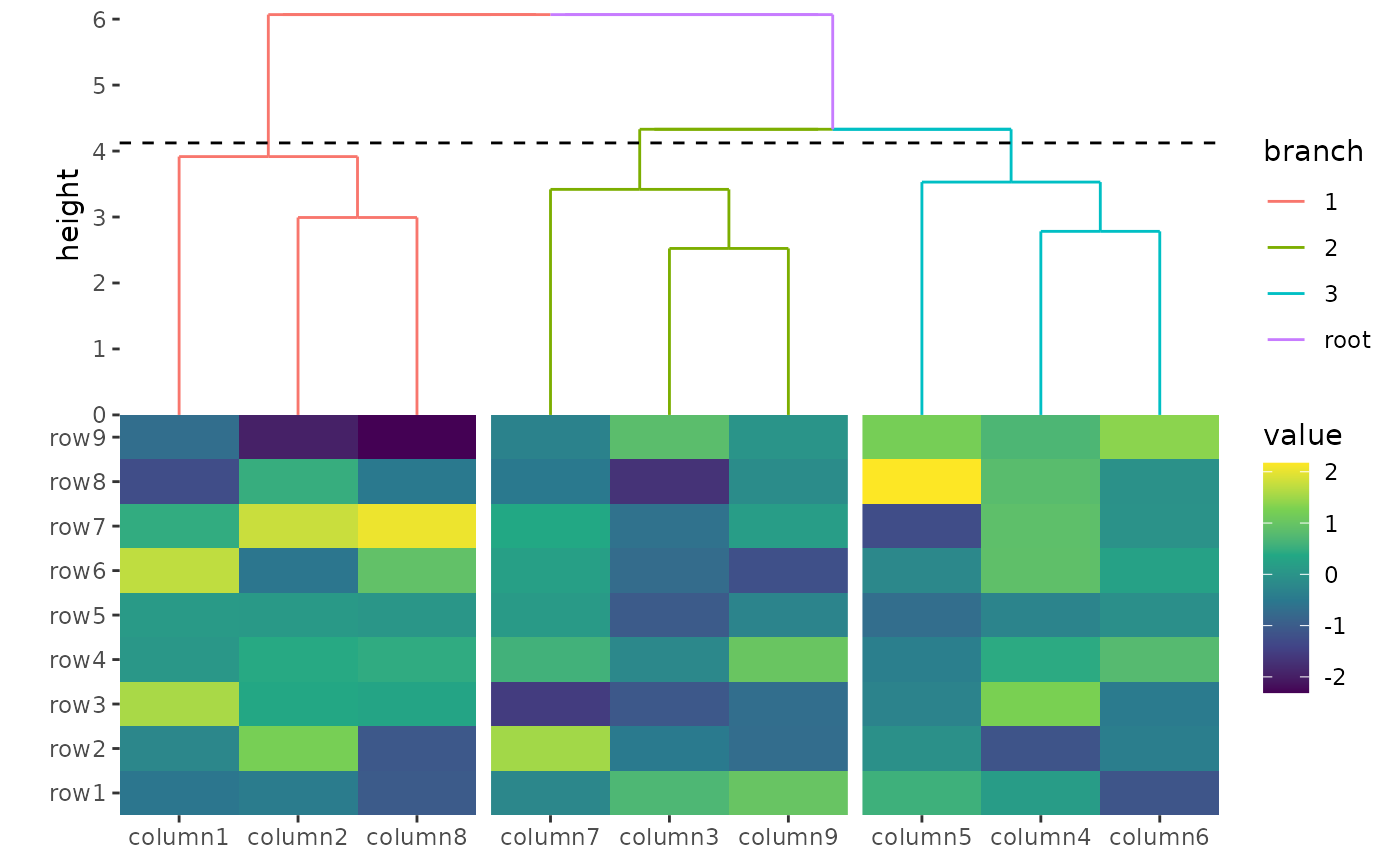
# Example 2: Manually order rows using row names
ggoncoplot(
    mut_mat,
    map_width = c(snv = 0.5),
    map_height = c(indel = 0.9),
    reorder_row = FALSE
) +
    scale_fill_brewer(palette = "Dark2", na.translate = FALSE) +
    anno_left() +
    align_order(c("g2", "g1", "g3")) # Orders rows as g2, g1, g3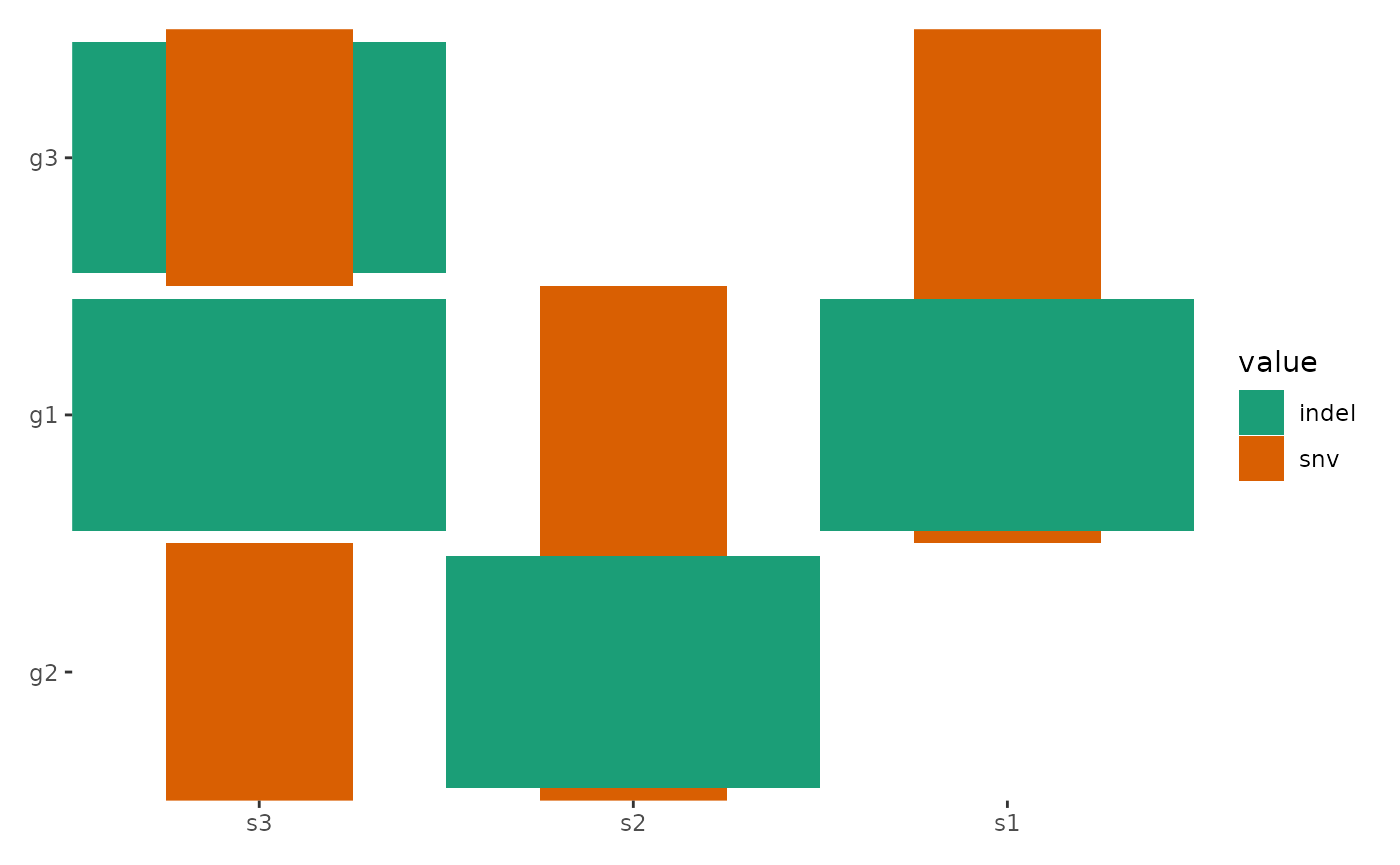
For row ordering, you can use either numeric indices (e.g., c(2, 3,
1)) or character names (e.g., c(“g2”, “g1”, “g3”)) if your matrix has
row names. For column ordering, simply replace anno_left()
with anno_top() or anno_bottom() and specify
the sample order in align_order(). Note the ordering
specified is from bottom to the top or from left to the right which
following the ggplot2 coordinates.
For certain objects related to ggoncoplot(), the
fortify_matrix() method includes a genes
argument that allows manual specification of gene order (character
only). You can define this argument directly within
ggoncoplot(), Currently, the supported objects for
oncoplot-specific usage include:
maftools- a matrix wrapped with
tune(matrix, "oncoplot")
The primary reason we must wrap a standard matrix with
tune() is that fortify_matrix() cannot
distinguish between the default matrix method and the one specifically
intended for ggoncoplot().
ggoncoplot(
    tune(mut_mat, "oncoplot"),
    genes = c("g2", "g1", "g3"), # Orders rows as g2, g1, g3
    map_width = c(snv = 0.5),
    map_height = c(indel = 0.9),
    reorder_row = FALSE
) +
scale_fill_brewer(palette = "Dark2", na.translate = FALSE) 
Can I change the default data for all geoms?
All function in ggalign requires specific data formats
for its operations. If you need to transform or filter data for
individual geoms, you can use the data
argument within each geom. However, if you have multiple
geoms and want a consistent transformation applied across
all, you can utilize the scheme_data() function which
allows you to transform the default data for all additive geoms.
Why are there spaces after setting all plot.margin to
zero?
By default, ggalign doesn’t add spaces between plots. If you notice spaces, they are likely due to:
- Plot margins within individual plots.
- Scale expansion automatically added by ggplot2.
You can resolve this by removing the scale expansion and adjusting the margins in the theme:
set.seed(123)
small_mat <- matrix(rnorm(81), nrow = 9)
rownames(small_mat) <- paste0("row", seq_len(nrow(small_mat)))
colnames(small_mat) <- paste0("column", seq_len(ncol(small_mat)))
ggheatmap(small_mat) +
    anno_top() +
    align_dendro(aes(color = branch), k = 3L) +
    scale_y_continuous(expand = expansion()) &
    theme(plot.margin = margin())
#> → heatmap built with `geom_tile()`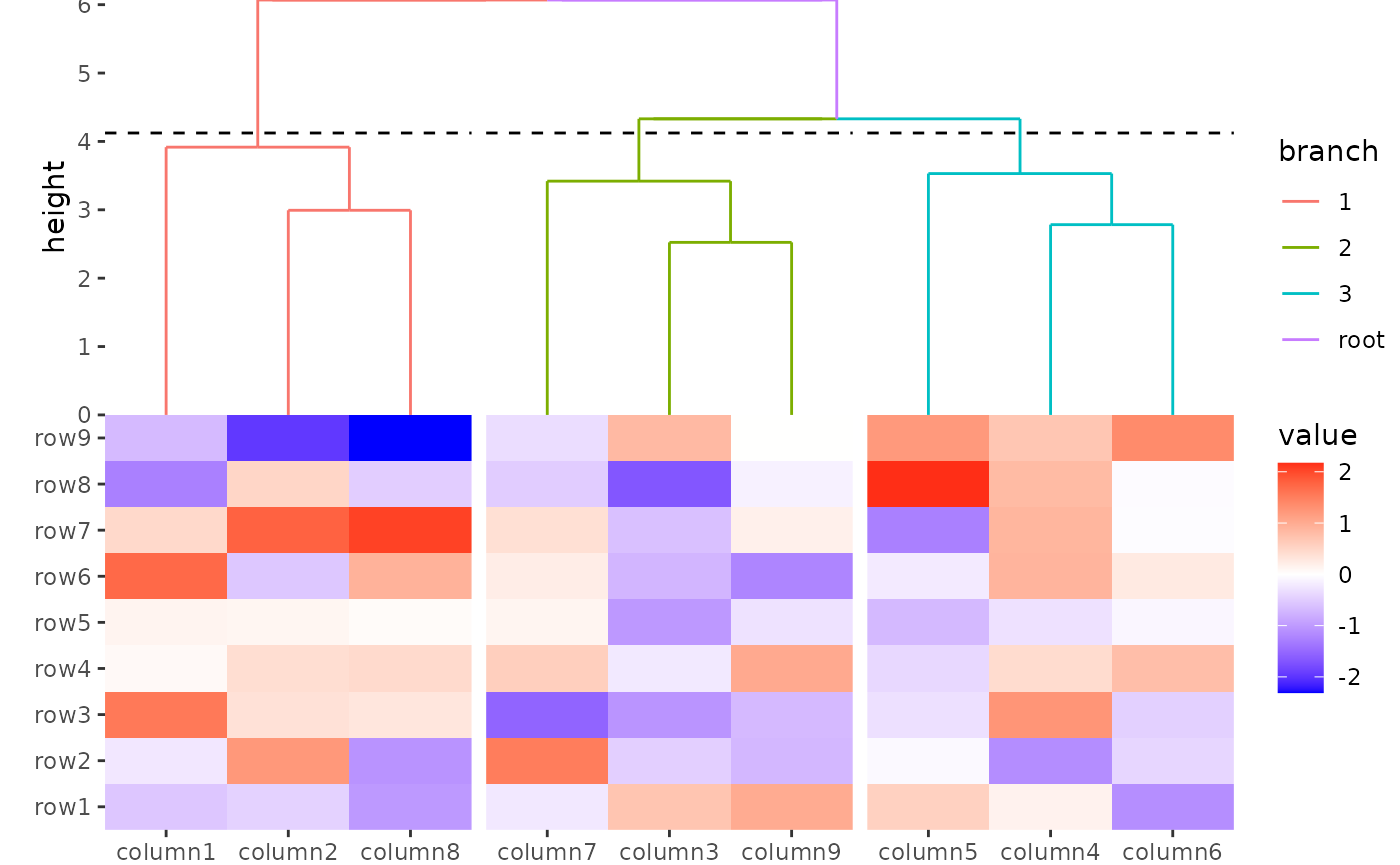
Why can’t I add two dendrograms with different reorder
settings?
Note: We always prevent users from reordering layout direction twice.
When reorder_group = FALSE is used, reordering of the
heatmap occurs within each group. As long as the ordering within each
group remains consistent, these two dendrograms can be placed on the
same axis of the heatmap.
set.seed(123)
small_mat <- matrix(rnorm(81), nrow = 9)
rownames(small_mat) <- paste0("row", seq_len(nrow(small_mat)))
colnames(small_mat) <- paste0("column", seq_len(ncol(small_mat)))
Let’s assume that panels represents the group for each observation and index represents the ordered index of the observations.
In the code provided, panels is initialized as ungrouped and index as unordered:
panels <- NULL
index <- NULL
set.seed(2L)
group <- sample(letters[1:3], ncol(small_mat), replace = TRUE)
h <- ggheatmap(small_mat) +
    anno_top() +
    align_group(group)
When we add a dendrogram with reorder_group = FALSE;
this’ll do something like this (Since
reorder_group = FALSE, the panels won’t be
changed):
h1 <- h + align_dendro(reorder_group = FALSE, merge_dendrogram = TRUE)
# always remember dendrogram will initialize the index, here, we extract the
# index from the underlying dendrogram
index <- stats::order.dendrogram(ggalign_stat(h1, "top", 2L))
However, if a dendrogram with reorder_group = TRUE is
then added, it will reorder the panels, so the underlying index will be
changed:
h2 <- h + align_dendro(reorder_group = TRUE, merge_dendrogram = TRUE)
new_index <- stats::order.dendrogram(ggalign_stat(h2, "top", 2L))
all(index == new_index)
#> [1] FALSE
To prevent reordering of the axis twice, we ensure that the
new_index matches the index (if
index is not NULL). This is done to maintain consistency
and prevent conflicts in the ordering of the heatmap.
Session information
sessionInfo()
#> R version 4.5.2 (2025-10-31)
#> Platform: x86_64-pc-linux-gnu
#> Running under: Ubuntu 24.04.3 LTS
#>
#> Matrix products: default
#> BLAS:   /usr/lib/x86_64-linux-gnu/openblas-pthread/libblas.so.3
#> LAPACK: /usr/lib/x86_64-linux-gnu/openblas-pthread/libopenblasp-r0.3.26.so;  LAPACK version 3.12.0
#>
#> locale:
#>  [1] LC_CTYPE=C.UTF-8       LC_NUMERIC=C           LC_TIME=C.UTF-8
#>  [4] LC_COLLATE=C.UTF-8     LC_MONETARY=C.UTF-8    LC_MESSAGES=C.UTF-8
#>  [7] LC_PAPER=C.UTF-8       LC_NAME=C              LC_ADDRESS=C
#> [10] LC_TELEPHONE=C         LC_MEASUREMENT=C.UTF-8 LC_IDENTIFICATION=C
#>
#> time zone: UTC
#> tzcode source: system (glibc)
#>
#> attached base packages:
#> [1] stats     graphics  grDevices utils     datasets  methods   base
#>
#> other attached packages:
#> [1] ggalign_1.2.0.9000 ggplot2_4.0.1
#>
#> loaded via a namespace (and not attached):
#>  [1] vctrs_0.6.5        cli_3.6.5          knitr_1.51         rlang_1.1.7
#>  [5] xfun_0.55          S7_0.2.1           textshaping_1.0.4  jsonlite_2.0.0
#>  [9] labeling_0.4.3     glue_1.8.0         htmltools_0.5.9    ragg_1.5.0
#> [13] sass_0.4.10        scales_1.4.0       rmarkdown_2.30     grid_4.5.2
#> [17] evaluate_1.0.5     jquerylib_0.1.4    fastmap_1.2.0      yaml_2.3.12
#> [21] lifecycle_1.0.5    compiler_4.5.2     RColorBrewer_1.1-3 fs_1.6.6
#> [25] systemfonts_1.3.1  farver_2.1.2       digest_0.6.39      R6_2.6.1
#> [29] pillar_1.11.1      bslib_0.9.0        withr_3.0.2        tools_4.5.2
#> [33] gtable_0.3.6       pkgdown_2.2.0      cachem_1.1.0       desc_1.4.3