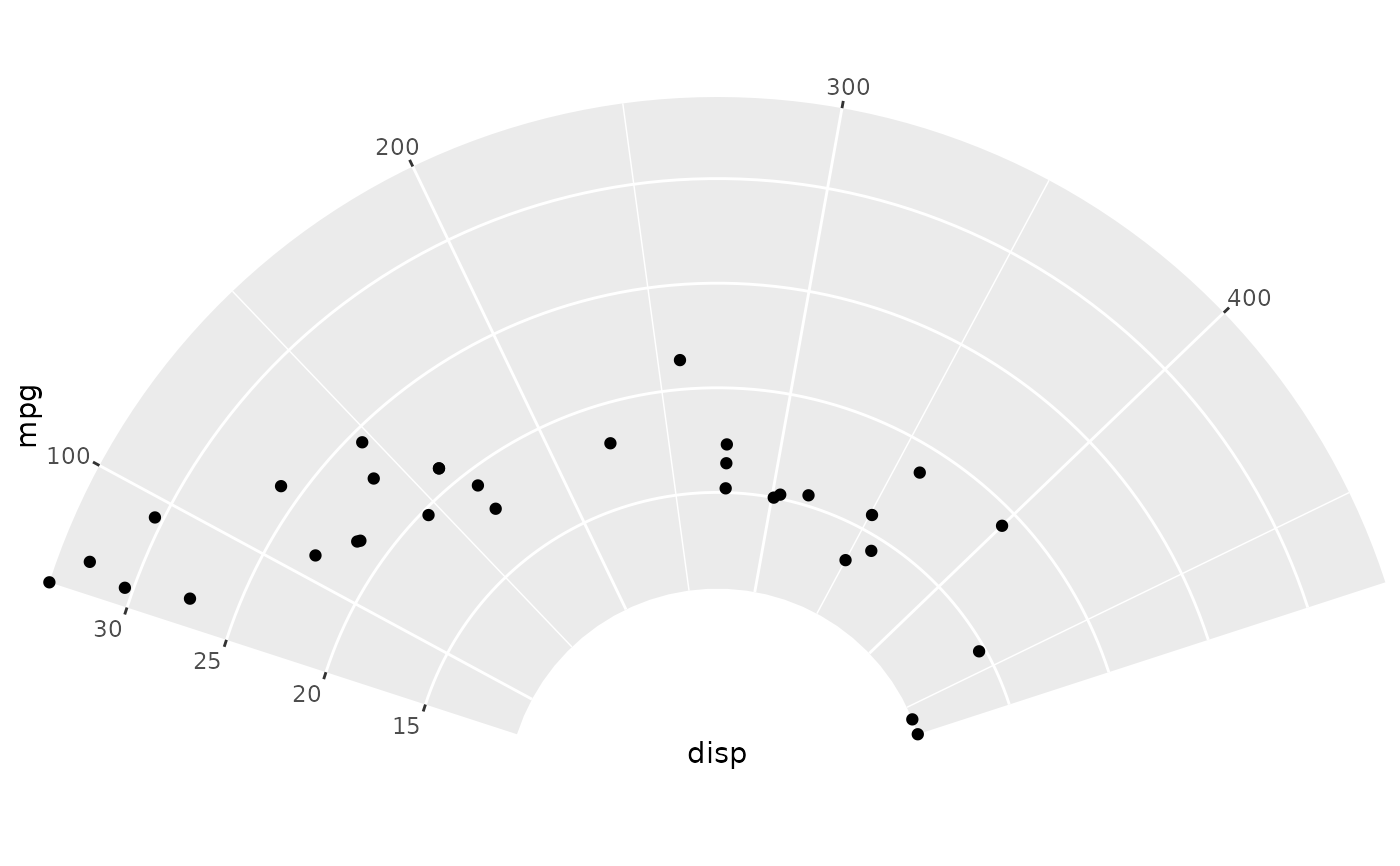
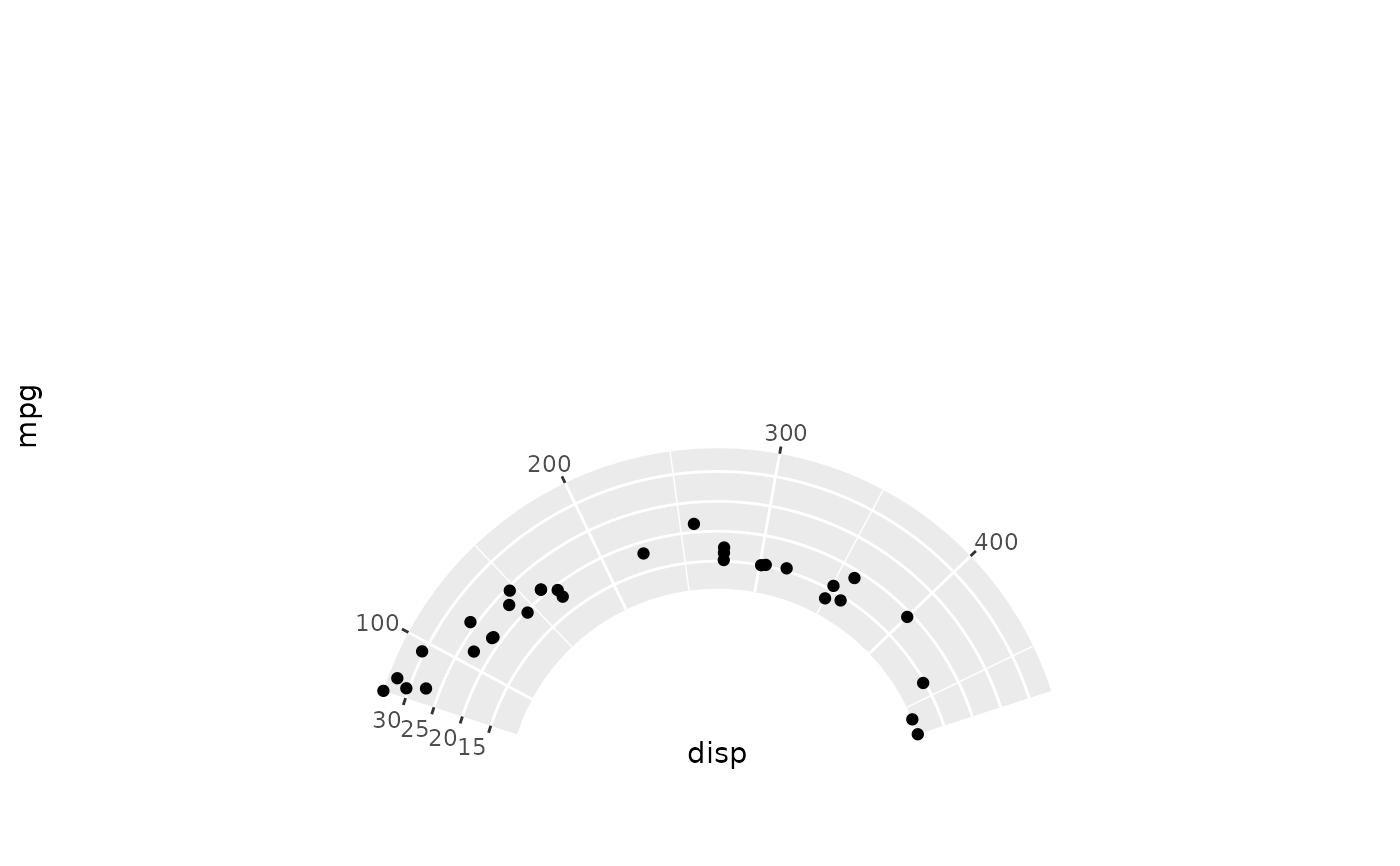
An extended version of coord_radial(), providing
additional customization options.
Usage
coord_circle(
  theta = "x",
  start = 0,
  end = NULL,
  thetalim = NULL,
  rlim = NULL,
  expand = FALSE,
  direction = 1,
  clip = "off",
  r.axis.inside = NULL,
  rotate.angle = FALSE,
  inner.radius = 0,
  outer.radius = 0.95
)
Arguments
- theta
variable to map angle to (
xory)- start
Offset of starting point from 12 o'clock in radians. Offset is applied clockwise or anticlockwise depending on value of
direction.- end
Position from 12 o'clock in radians where plot ends, to allow for partial polar coordinates. The default,
NULL, is set tostart + 2 * pi.- thetalim, rlim
Limits for the
thetaandraxes.- expand
If
TRUE, the default, adds a small expansion factor to the limits to prevent overlap between data and axes. IfFALSE, limits are taken directly from the scale.- direction
1, clockwise; -1, anticlockwise
- clip
Should drawing be clipped to the extent of the plot panel? A setting of
"on"(the default) means yes, and a setting of"off"means no. For details, please seecoord_cartesian().- r.axis.inside
One of the following:
NULL(default) places the axis next to the panel ifstartandendarguments form a full circle and inside the panel otherwise.TRUEto place the radius axis inside the panel.FALSEto place the radius axis next to the panel.A numeric value, setting a theta axis value at which the axis should be placed inside the panel. Can be given as a length 2 vector to control primary and secondary axis placement separately.
- rotate.angle
If
TRUE, transforms theangleaesthetic in data in accordance with the computedthetaposition. IfFALSE(default), no such transformation is performed. Can be useful to rotate text geoms in alignment with the coordinates.- inner.radius
A numeric in
[0, 1)indicates the inner radius.- outer.radius
A numeric in
(0, 1]indicates the outer radius.coord_radial()by default uses0.8.