Free plots from alignment constraints
Source:R/alignpatch-free-align.R, R/alignpatch-free-border.R, R/alignpatch-free-guide.R, and 3 more
free.RdBy default, alignpatches()/align_plots() attempts to align all plot
panels and their elements. The following helper functions can be used to
selectively remove or relax these alignment constraints:
Usage
free_align(plot, axes = "tlbr")

free_border(plot, borders = "tlbr")

free_guide(plot, guides = "tlbr")

free_lab(plot, labs = "tlbr")

free_space(plot, spaces = "tlbr")

free_vp(plot, x = 0.5, y = 0.5, width = NA, height = NA, ..., resize = TRUE)
Arguments
- plot
Any object that can be aligned with
alignpatches(). In practice, this means the object must implement thepatch()method.- axes
Which axes shouldn't be aligned? A string containing one or more of
"t","l","b", and"r".- borders
Which border shouldn't be aligned? A string containing one or more of
"t","l","b", and"r".- guides
A string containing one or more of
"t","l","b","r", and"i"indicates which side of guide legends should be collected for the plot. IfNULL, no guide legends will be collected.- labs
Which axis labs to be free? A string containing one or more of
"t","l","b", and"r".- spaces
Which border spaces should be removed? A string containing one or more of
"t","l","b", and"r".- x
A numeric vector or unit object specifying x-location.
- y
A numeric vector or unit object specifying y-location.
- width
A numeric vector or unit object specifying width.
- height
A numeric vector or unit object specifying height.
- ...
Arguments passed on to
grid::viewportdefault.unitsA string indicating the default units to use if
x,y,width, orheightare only given as numeric vectors.justA string or numeric vector specifying the justification of the viewport relative to its (x, y) location. If there are two values, the first value specifies horizontal justification and the second value specifies vertical justification. Possible string values are:
"left","right","centre","center","bottom", and"top". For numeric values, 0 means left alignment and 1 means right alignment.gpAn object of class
"gpar", typically the output from a call to the functiongpar. This is basically a list of graphical parameter settings.clipOne of
"on","inherit", or"off", indicating whether to clip to the extent of this viewport, inherit the clipping region from the parent viewport, or turn clipping off altogether. For back-compatibility, a logical value ofTRUEcorresponds to"on"andFALSEcorresponds to"inherit".May also be a grob (or a gTree) that describes a clipping path or the result of a call to
as.path.maskOne of
"none"(orFALSE) or"inherit"(orTRUE) or a grob (or a gTree) or the result of call toas.mask. This specifies that the viewport should have no mask, or it should inherit the mask of its parent, or it should have its own mask, as described by the grob.xscaleA numeric vector of length two indicating the minimum and maximum on the x-scale. The limits may not be identical.
yscaleA numeric vector of length two indicating the minimum and maximum on the y-scale. The limits may not be identical.
angleA numeric value indicating the angle of rotation of the viewport. Positive values indicate the amount of rotation, in degrees, anticlockwise from the positive x-axis.
layoutA Grid layout object which splits the viewport into subregions.
layout.pos.rowA numeric vector giving the rows occupied by this viewport in its parent's layout.
layout.pos.colA numeric vector giving the columns occupied by this viewport in its parent's layout.
nameA character value to uniquely identify the viewport once it has been pushed onto the viewport tree.
- resize
A logical value. If
TRUE, the viewport will be resized to accommodate the underlying gtable. This only applies when both the viewport width/height and the underlying gtable widths/heights are specified using absolute units. IfTRUEand the viewport width/height isNA, the width/height will be set to match the gtable's widths/heights. Otherwise, the width/height will be set tounit(1, "npc"). Seeabsolute.size()for absolute unit.
Value
free_align: A modified version ofplotwith aggalign_free_alignclass.
free_border: A modified version ofplotwith aggalign_free_borderclass.
free_guide: A modified version ofplotwith aggalign_free_guideclass.
free_lab: A modified version ofplotwith aggalign_free_labclass.
free_space: A modified version ofplotwith aggalign_free_spaceclass.
free_vp: A modified version ofplotwith aggalign_free_vpclass.
Details
free_align(): Prevents alignment of specific plot panels along certain axes. Wrap the plot withfree_align()if you want to compose plots without forcing axis alignment.free_border(): Aligns the panel area but not its surrounding borders (such as axis titles, tick marks, or labels).free_lab(): attaches axis titles and tick labels directly to the plot panel.free_space(): Removes border spacing when aligning plots.free_vp: Customize the viewport when aligning.free_guide: If we want to override the behaviour of the overall guides behaviour, we can wrap the plot withfree_guide.
Examples
# directly copied from `patchwork`
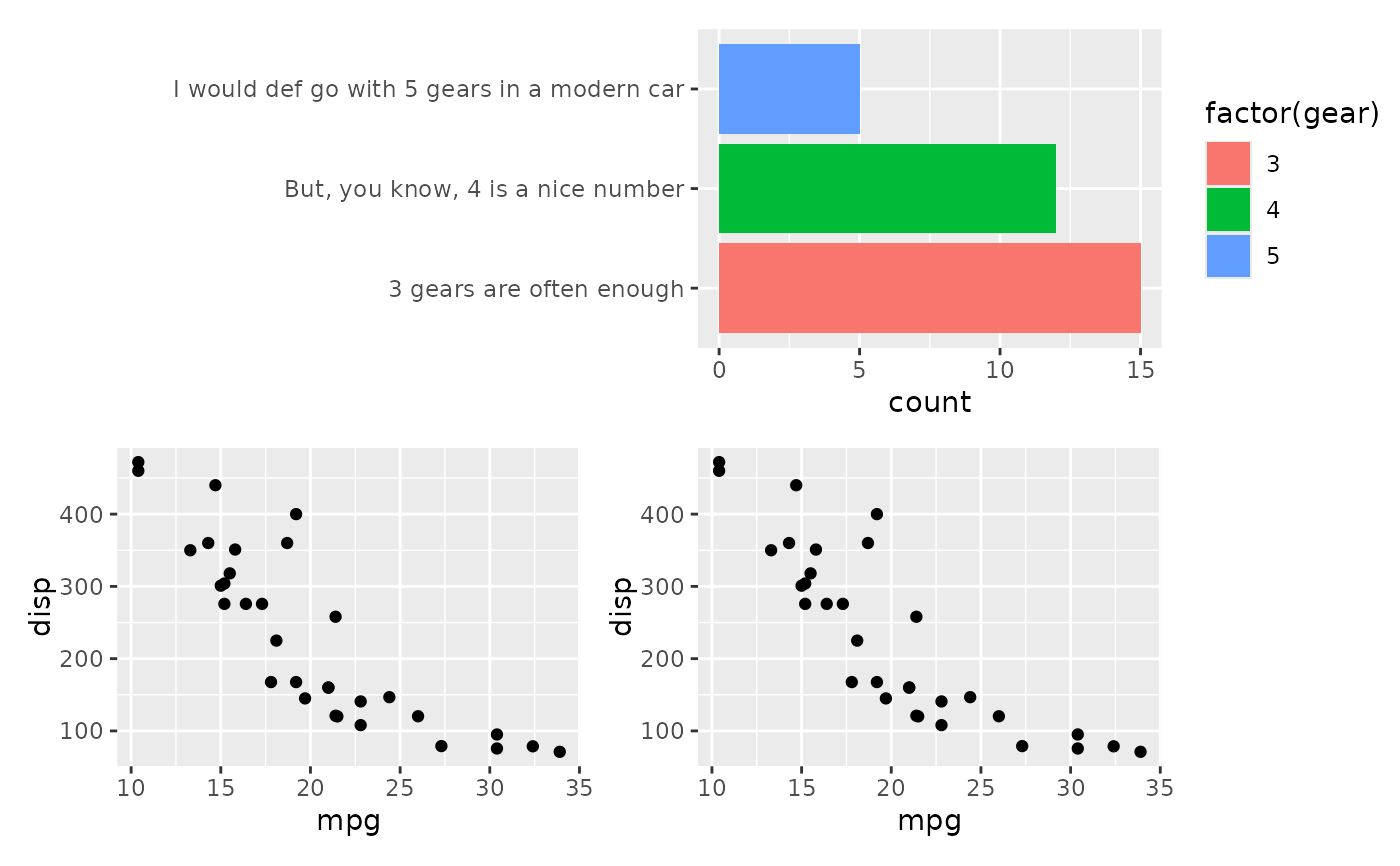
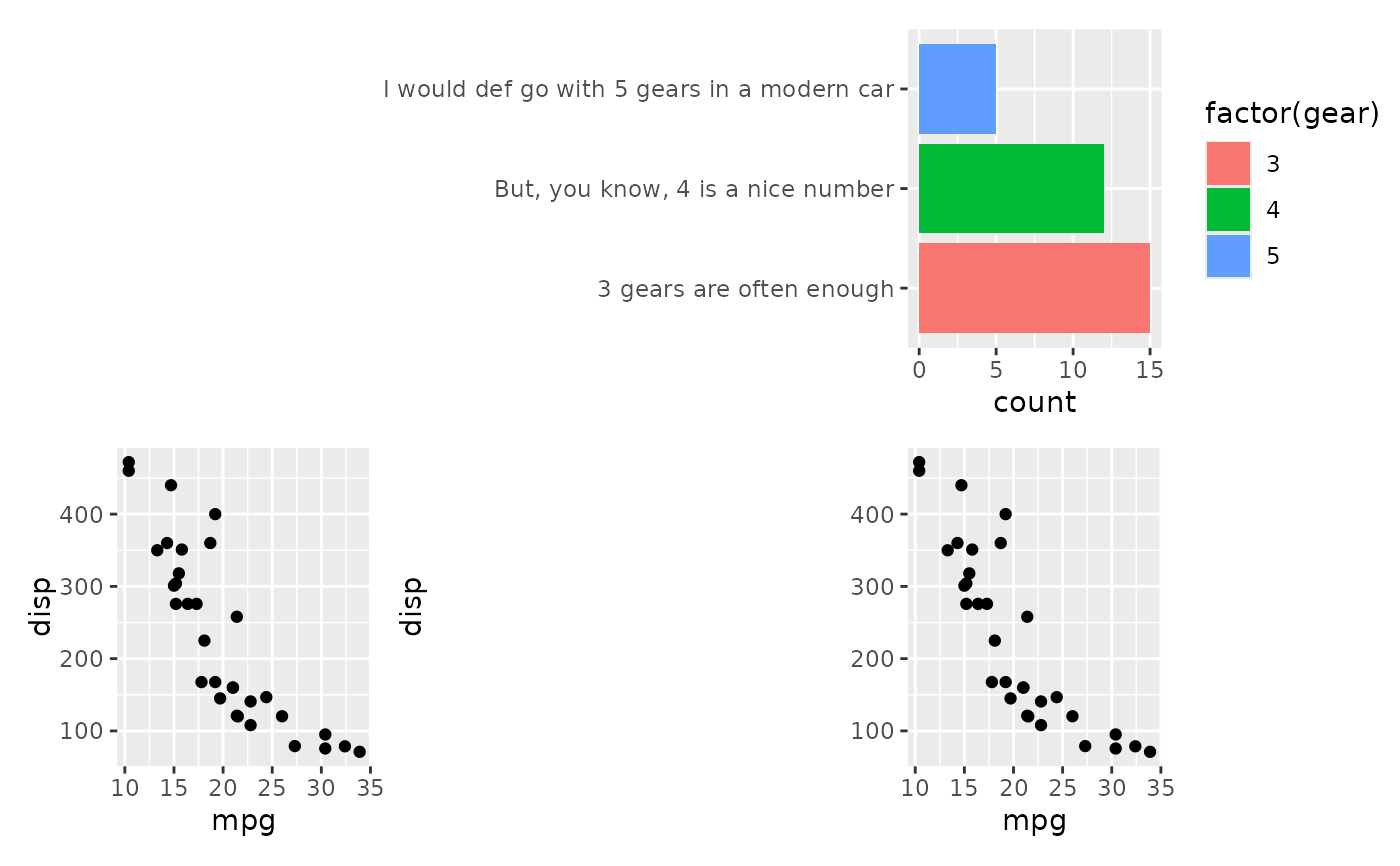
# Sometimes you have a plot that defies good composition alginment, e.g. due
# to long axis labels
p1 <- ggplot(mtcars) +
geom_bar(aes(y = factor(gear), fill = factor(gear))) +
scale_y_discrete(
"",
labels = c(
"3 gears are often enough",
"But, you know, 4 is a nice number",
"I would def go with 5 gears in a modern car"
)
)
# When combined with other plots it ends up looking bad
p2 <- ggplot(mtcars) +
geom_point(aes(mpg, disp))
align_plots(p1, p2, ncol = 1L)
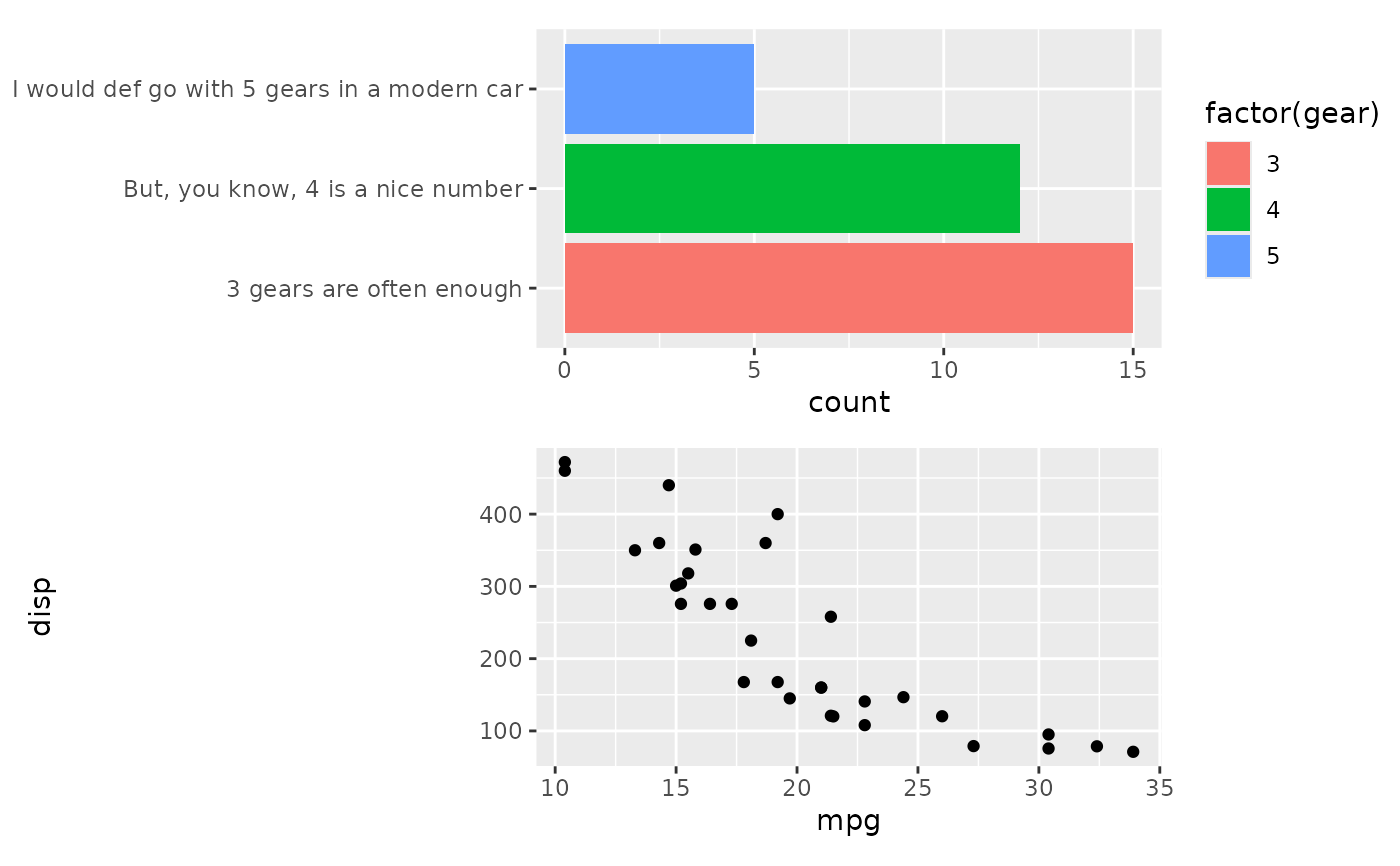 # We can fix this be using `free_align`
align_plots(free_align(p1), p2, ncol = 1L)
# We can fix this be using `free_align`
align_plots(free_align(p1), p2, ncol = 1L)
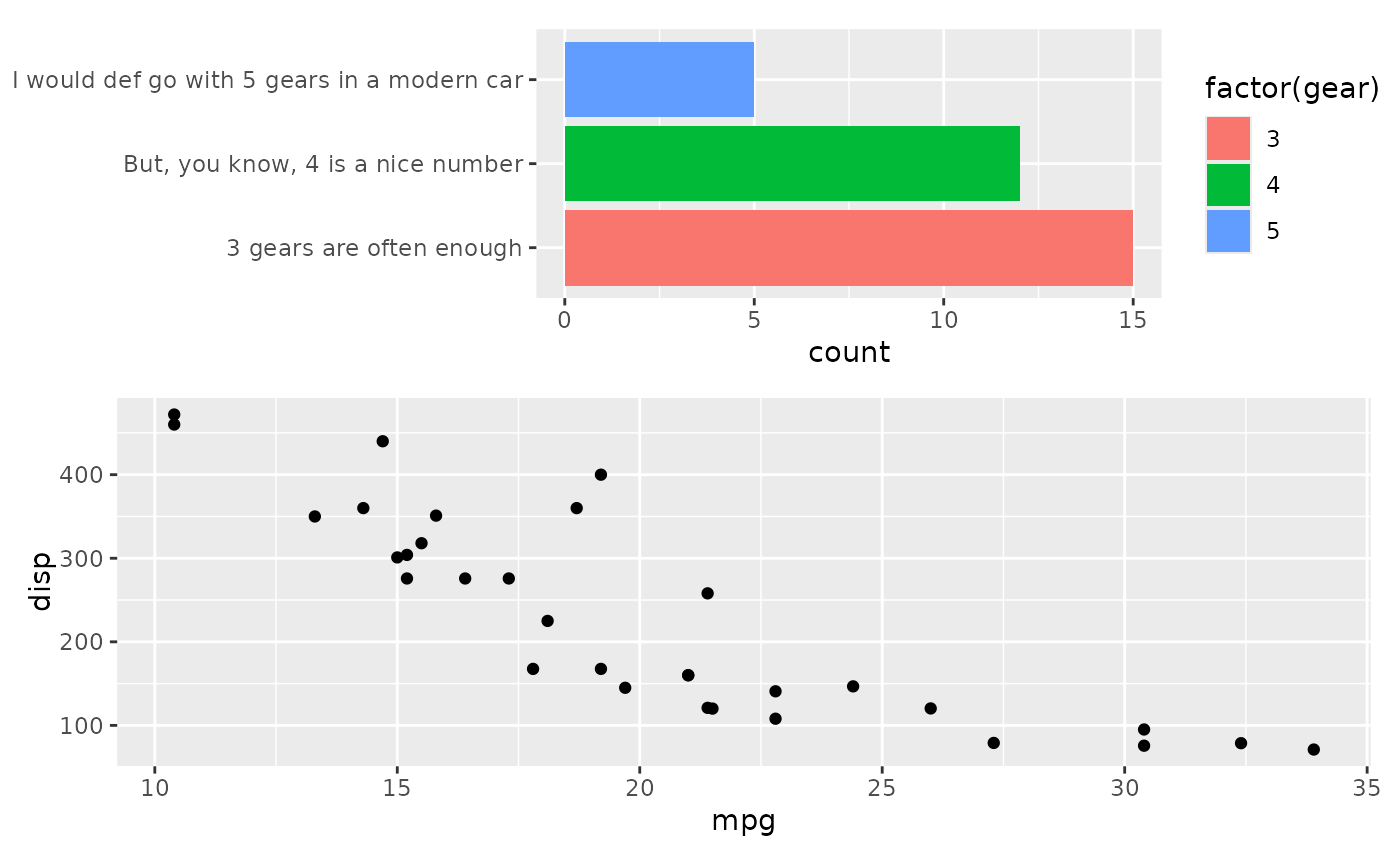 # If we still want the panels to be aligned to the right, we can choose to
# free only the left side
align_plots(free_align(p1, axes = "l"), p2, ncol = 1L)
# If we still want the panels to be aligned to the right, we can choose to
# free only the left side
align_plots(free_align(p1, axes = "l"), p2, ncol = 1L)
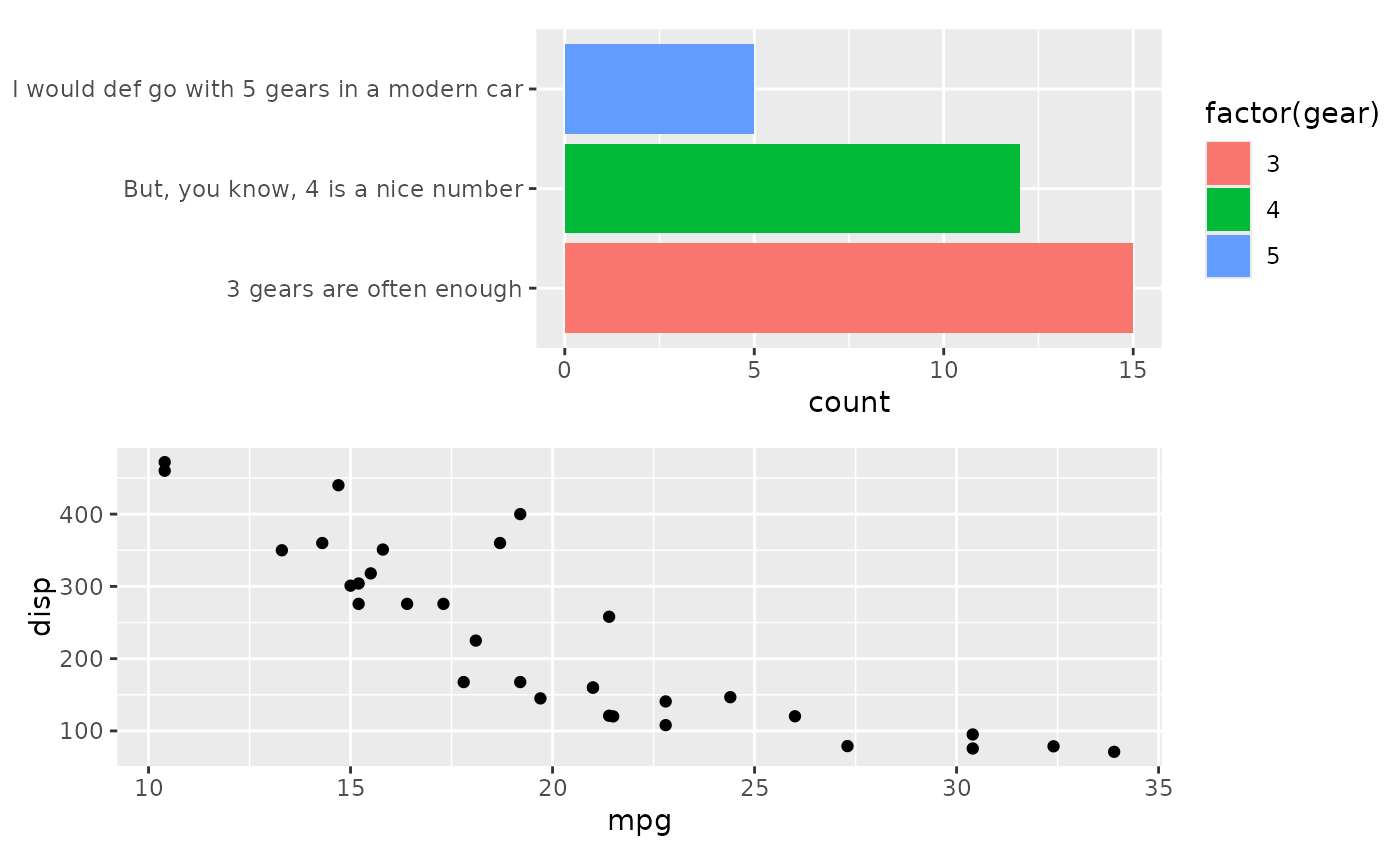 # We could use `free_lab` to fix the layout in a different way
align_plots(p1, free_lab(p2), ncol = 1L)
# We could use `free_lab` to fix the layout in a different way
align_plots(p1, free_lab(p2), ncol = 1L)
 # `free_border()` is similar with `free_lab`, they have a distinction in
# terms of placement on either the top or bottom side of the panel.
# Specifically, the top side contains the `title` and `subtitle`, while the
# bottom side contains the `caption`. `free_border()` also free these
# elements when ligning.
p3 <- ggplot(mtcars) +
geom_point(aes(hp, wt, colour = mpg)) +
ggtitle("Plot 3")
p_axis_top <- ggplot(mtcars) +
geom_point(aes(mpg, disp)) +
ggtitle("Plot axis in top") +
scale_x_continuous(position = "top")
align_plots(p_axis_top, free_lab(p3))
# `free_border()` is similar with `free_lab`, they have a distinction in
# terms of placement on either the top or bottom side of the panel.
# Specifically, the top side contains the `title` and `subtitle`, while the
# bottom side contains the `caption`. `free_border()` also free these
# elements when ligning.
p3 <- ggplot(mtcars) +
geom_point(aes(hp, wt, colour = mpg)) +
ggtitle("Plot 3")
p_axis_top <- ggplot(mtcars) +
geom_point(aes(mpg, disp)) +
ggtitle("Plot axis in top") +
scale_x_continuous(position = "top")
align_plots(p_axis_top, free_lab(p3))
 align_plots(p_axis_top, free_border(p3))
 # Another issue is that long labels can occupy much spaces
align_plots(NULL, p1, p2, p2)
# Another issue is that long labels can occupy much spaces
align_plots(NULL, p1, p2, p2)
 # This can be fixed with `free_space`
align_plots(NULL, free_space(p1, "l"), p2, p2)
# This can be fixed with `free_space`
align_plots(NULL, free_space(p1, "l"), p2, p2)