To control how different plots are laid out, you need to add a layout design specification. If you are nesting grids, the layout is scoped to the current nesting level.
Usage
layout_design(
  ncol = NA_real_,
  nrow = NA_real_,
  byrow = NA,
  widths = NULL,
  heights = NULL,
  area = waiver(),
  guides = NA_character_
)
Arguments
- ncol, nrow
The number of columns and rows in the grid. Defaults to
NULL. If both areNULL, the layout dimensions are determined automatically using the same logic asfacet_wrap().- byrow
A logical value indicating whether plots should be filled in row-major order (
TRUE) or column-major order (FALSE). Defaults toTRUE.- widths, heights
The relative widths and heights of each column and row in the grid. These values are recycled to match the grid dimensions. The special value
NAis treated as a unit of1null, unless a fixed-aspect plot is included — in that case, the affected dimension will expand or contract to maintain the aspect ratio of the plot. Defaults toNA.- area
A specification of the area layout. Can be defined either as a character string or as a combination of calls to
area(). Defaults toNULL.- guides
A string with one or more of
"t","l","b","r", and"i"indicating which side of guide legends should be collected. Defaults towaiver(), which inherits from the parent layout. If there is no parent layout, or ifNULLis provided, no guides will be collected.
Examples
p1 <- ggplot(mtcars) +
geom_point(aes(mpg, disp))
p2 <- ggplot(mtcars) +
geom_boxplot(aes(gear, disp, group = gear))
p3 <- ggplot(mtcars) +
geom_bar(aes(gear)) +
facet_wrap(~cyl)
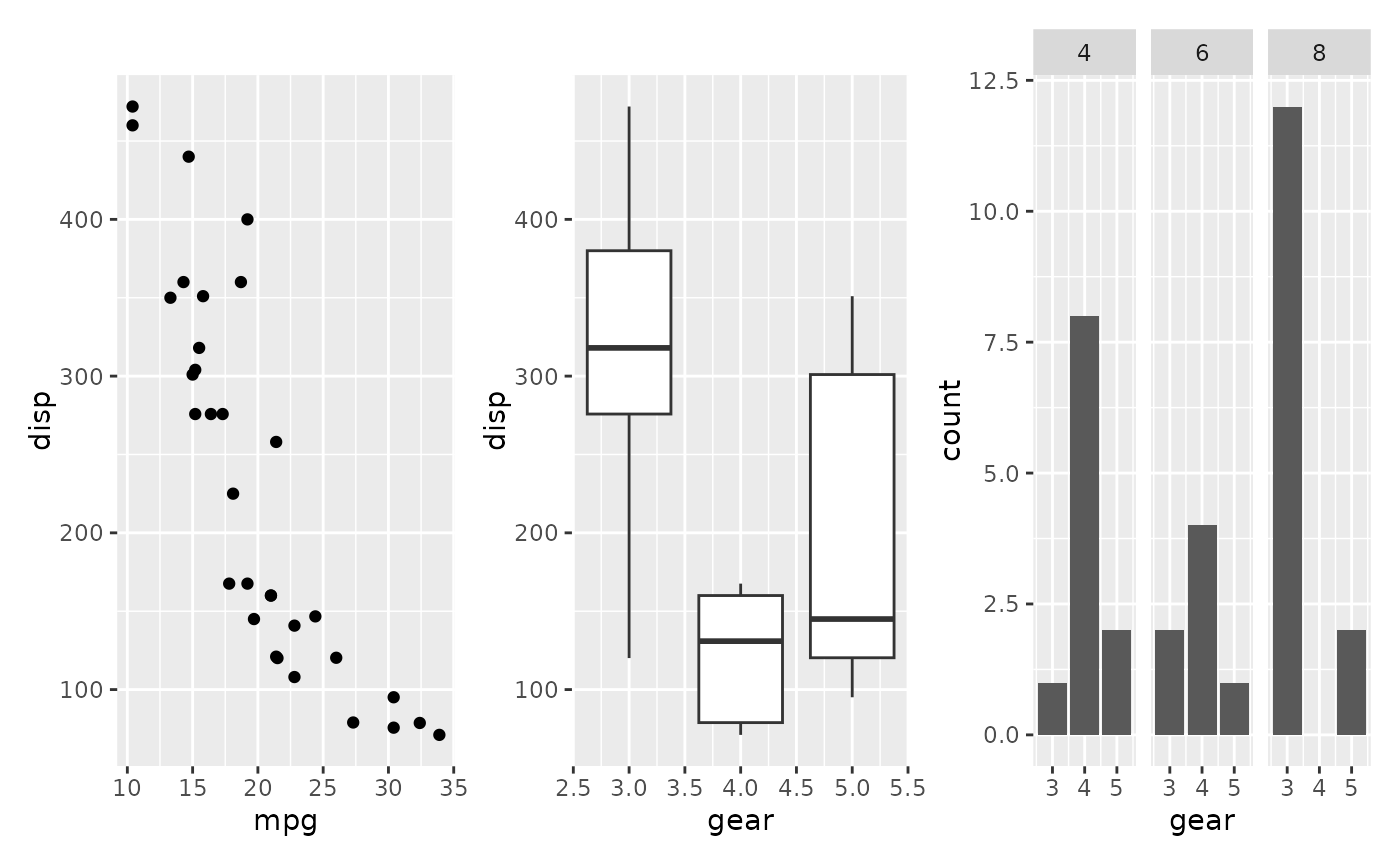
align_plots(p1, p2, p3) +
layout_design(nrow = 1L)
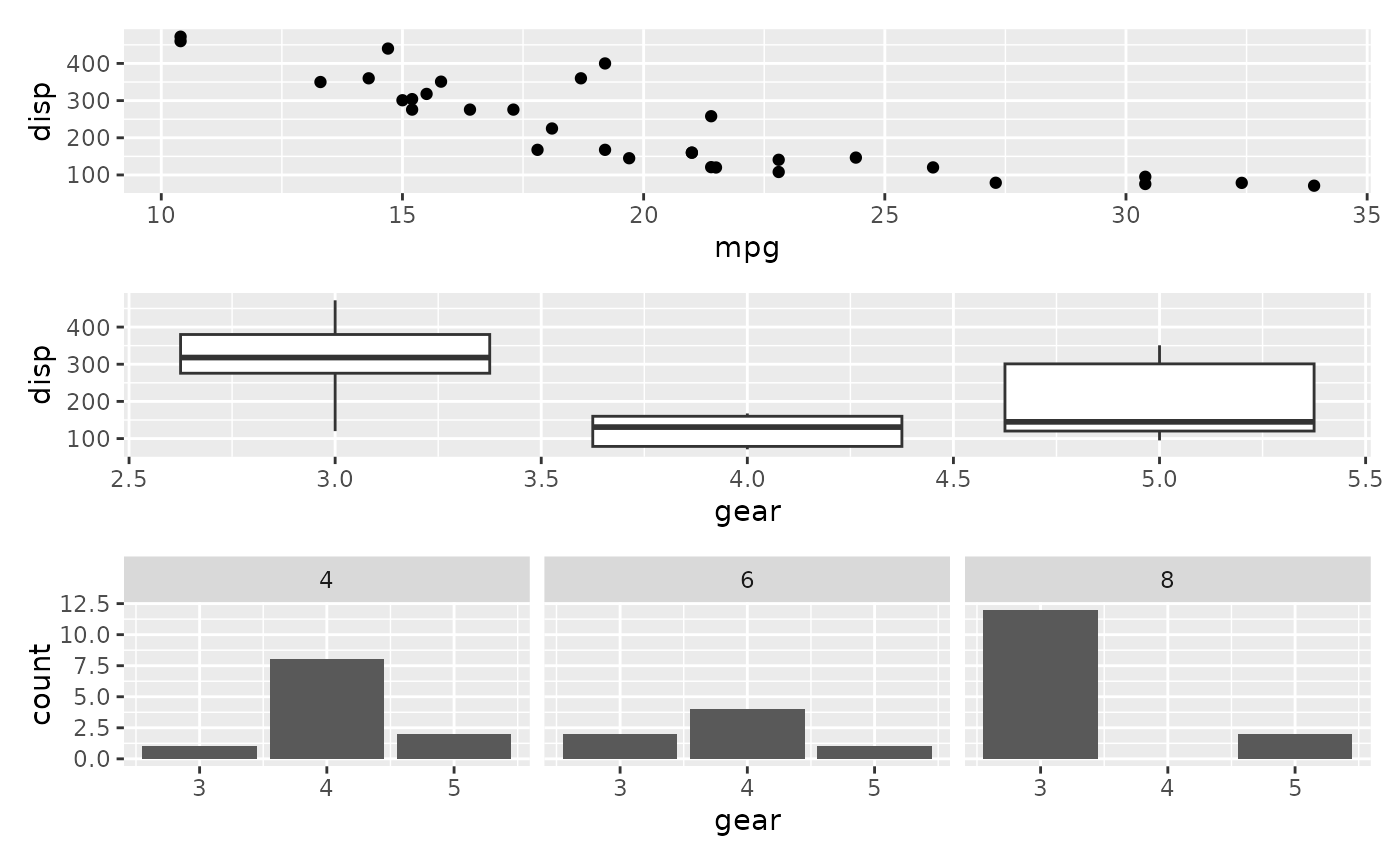
 align_plots(p1, p2, p3) +
layout_design(ncol = 1L)
align_plots(p1, p2, p3) +
layout_design(ncol = 1L)