If limits is provided, a continuous variable will be required and aligned
in the direction specified (circle_continuous). Otherwise, a discrete
variable will be required and aligned (circle_discrete).
Usage
circle_layout(
  data = NULL,
  ...,
  radial = NULL,
  direction = "outward",
  sector_spacing = NULL,
  limits = waiver(),
  theme = NULL,
  spacing_theta = deprecated()
)

circle_discrete(
  data = NULL,
  ...,
  radial = NULL,
  direction = "outward",
  sector_spacing = NULL,
  theme = NULL,
  spacing_theta = deprecated()
)

circle_continuous(
  data = NULL,
  ...,
  radial = NULL,
  direction = "outward",
  sector_spacing = NULL,
  limits = NULL,
  theme = NULL,
  spacing_theta = deprecated()
)
Arguments
- data
Default dataset to use for the layout. If not specified, it must be supplied in each plot added to the layout:
If
limitsis not provided,fortify_matrix()will be used to get a matrix.If
limitsis specified,fortify_data_frame()will be used to get a data frame.
- ...
Additional arguments passed to
fortify_data_frame()orfortify_matrix().- radial
A
coord_circle()/coord_radial()object that defines the global parameters for coordinate across all plots in the layout. The parametersstart,end,direction, andexpandwill be inherited and applied uniformly to all plots within the layout. The parametersthetaandr.axis.insidewill always be ignored and will be set to"x"andTRUE, respectively, for all plots.- direction
A single string of
"inward"or"outward", indicating the direction in which the plot is added.outward: The plot is added from the inner to the outer.inward: The plot is added from the outer to the inner.
- sector_spacing
The size of spacing between different panel. A numeric of the radians or a
rel()object.- limits
A
continuous_limits()object specifying the left/lower limit and the right/upper limit of the scale. Used to align the continuous axis.- theme
A
theme()object used to customize various elements of the layout, includingguides,title,subtitle,caption,margins,panel.border, andbackground. By default, the theme will inherit from the parentlayout. It also controls the panel spacing for all plots in the layout.- spacing_theta
Examples
set.seed(123)
small_mat <- matrix(rnorm(56), nrow = 7)
rownames(small_mat) <- paste0("row", seq_len(nrow(small_mat)))
colnames(small_mat) <- paste0("column", seq_len(ncol(small_mat)))
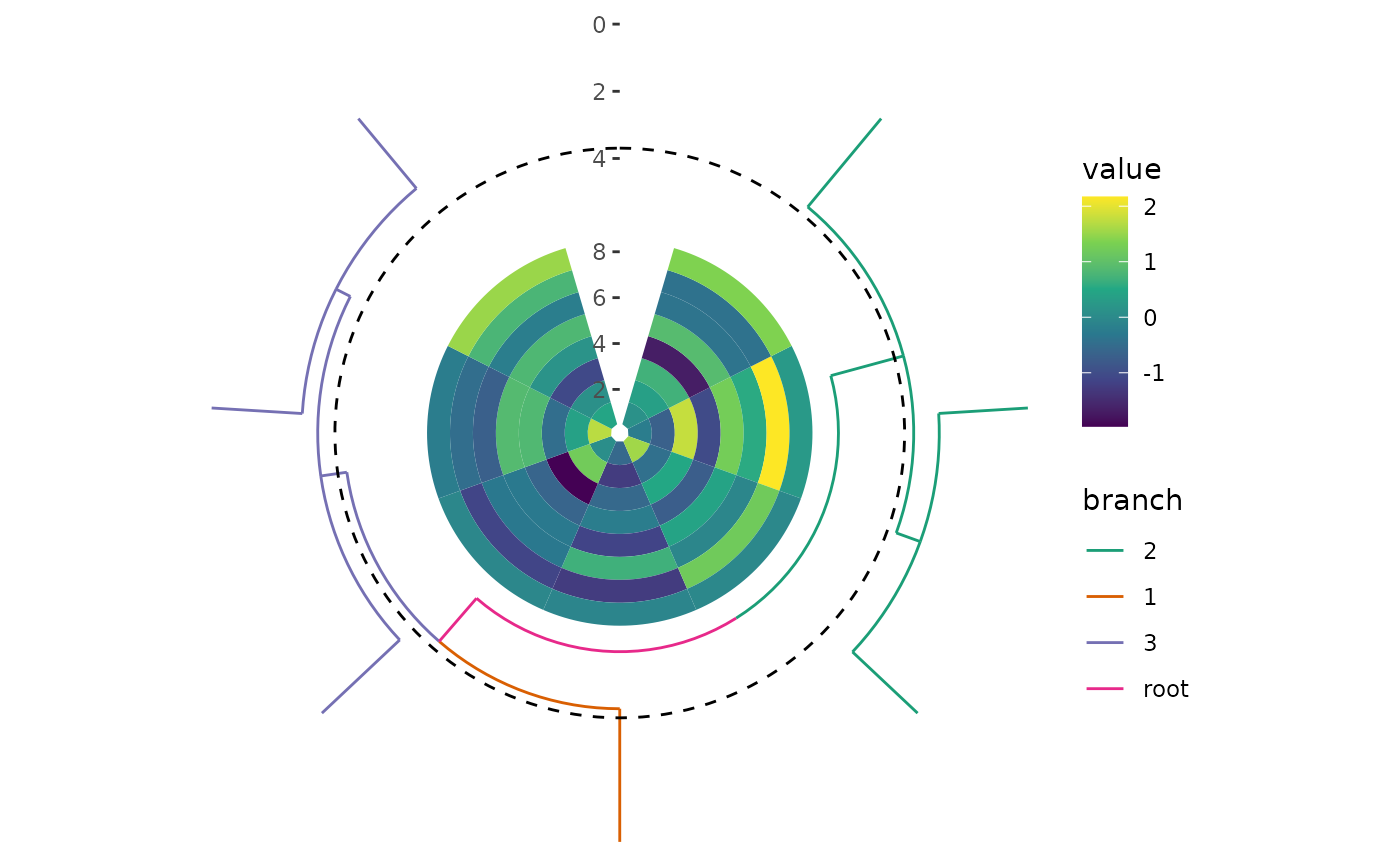
# circle_layout
# same for circle_discrete()
circle_layout(small_mat) +
ggalign() +
geom_tile(aes(y = .column_index, fill = value)) +
scale_fill_viridis_c() +
align_dendro(aes(color = branch), k = 3L) +
scale_color_brewer(palette = "Dark2")
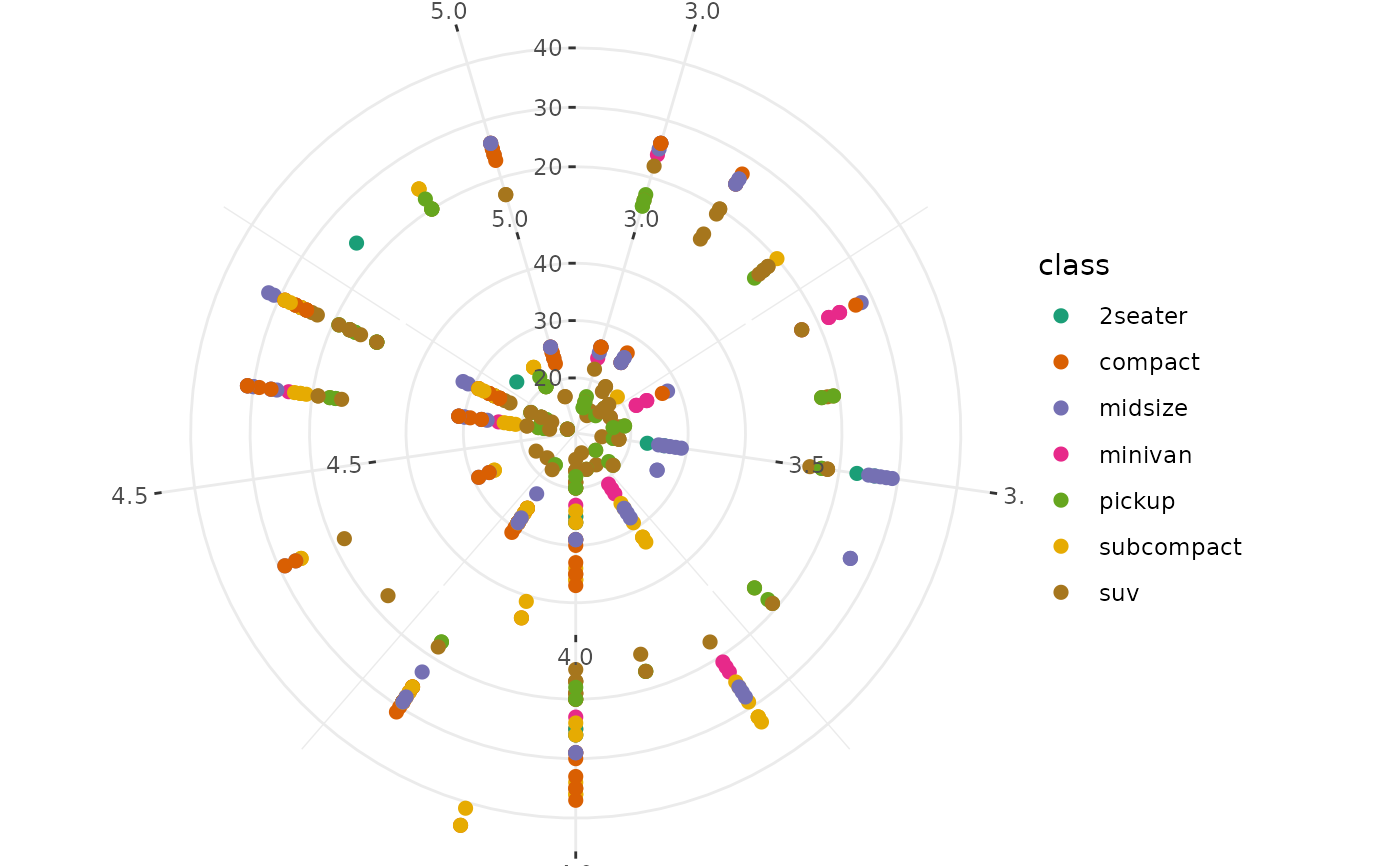
 # same for circle_continuous()
circle_layout(mpg, limits = continuous_limits(c(3, 5))) +
ggalign(mapping = aes(displ, hwy, colour = class)) +
geom_point(size = 2) +
ggalign(mapping = aes(displ, hwy, colour = class)) +
geom_point(size = 2) &
scale_color_brewer(palette = "Dark2") &
theme_bw()
 # circle_discrete()
# direction outward
circle_discrete(small_mat) +
align_dendro(aes(color = branch), k = 3L) +
scale_color_brewer(palette = "Dark2") +
ggalign() +
geom_tile(aes(y = .column_index, fill = value)) +
scale_fill_viridis_c()
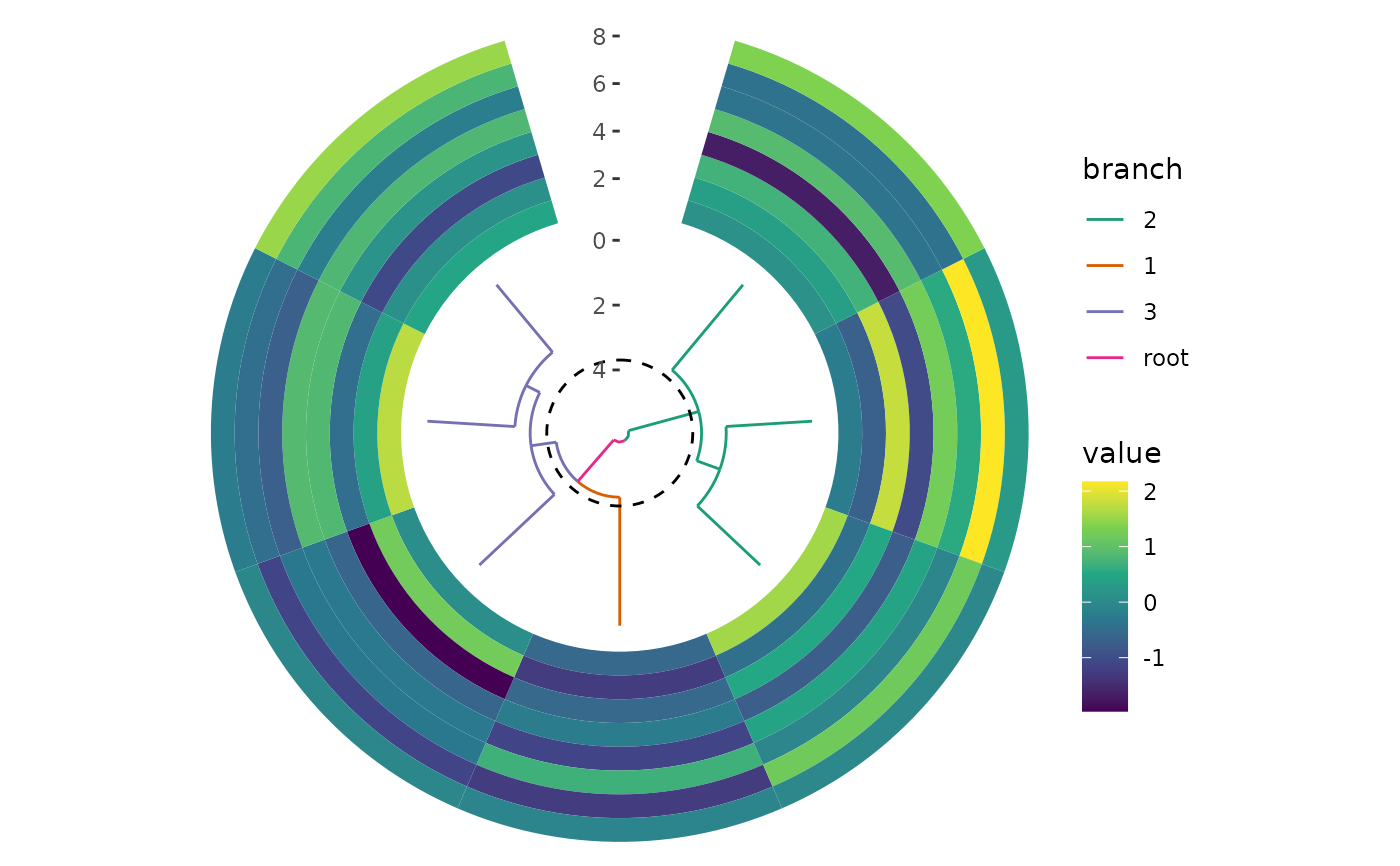 # direction inward
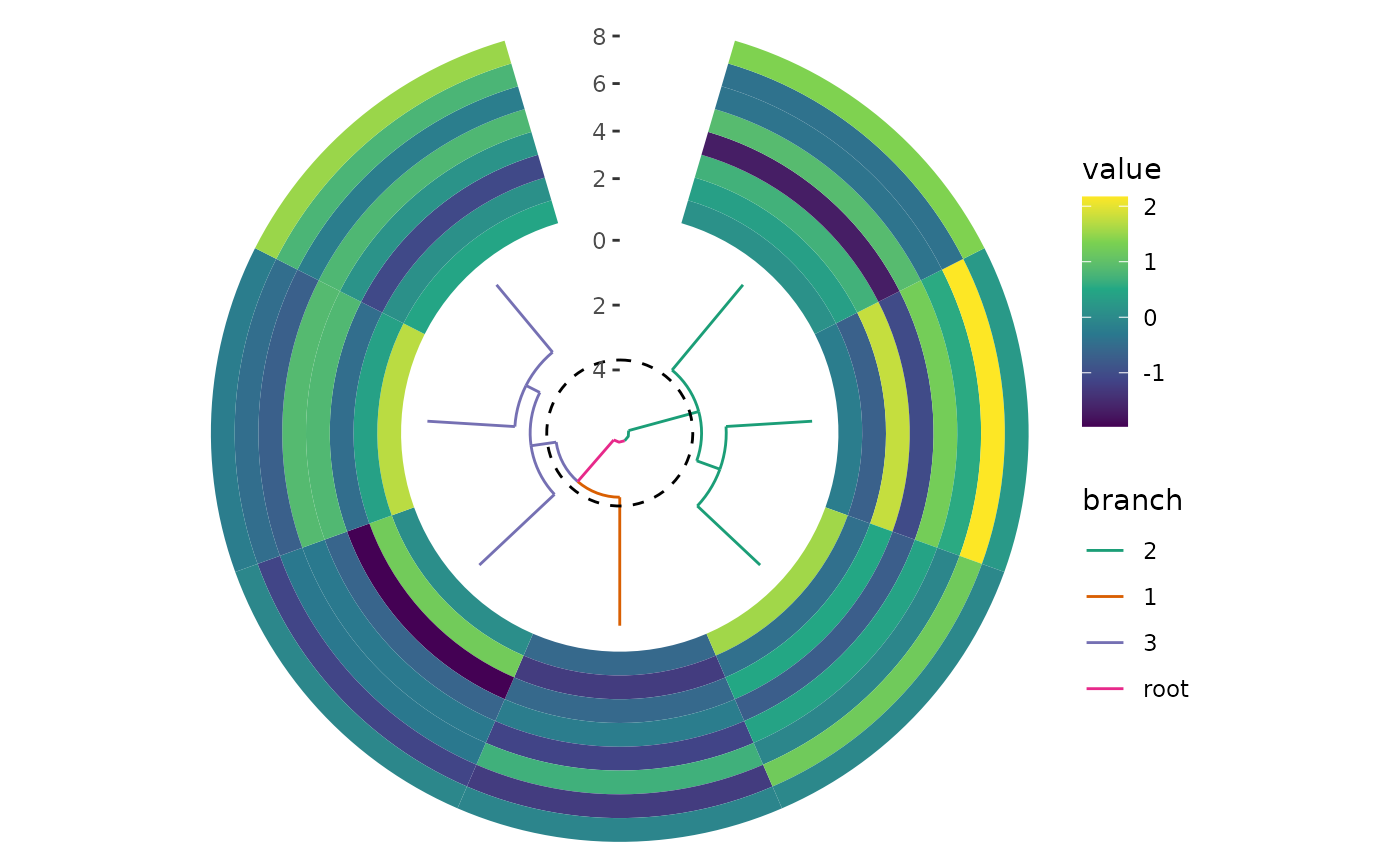
circle_discrete(small_mat, direction = "inward") +
ggalign() +
geom_tile(aes(y = .column_index, fill = value)) +
scale_fill_viridis_c() +
align_dendro(aes(color = branch), k = 3L) +
scale_color_brewer(palette = "Dark2")
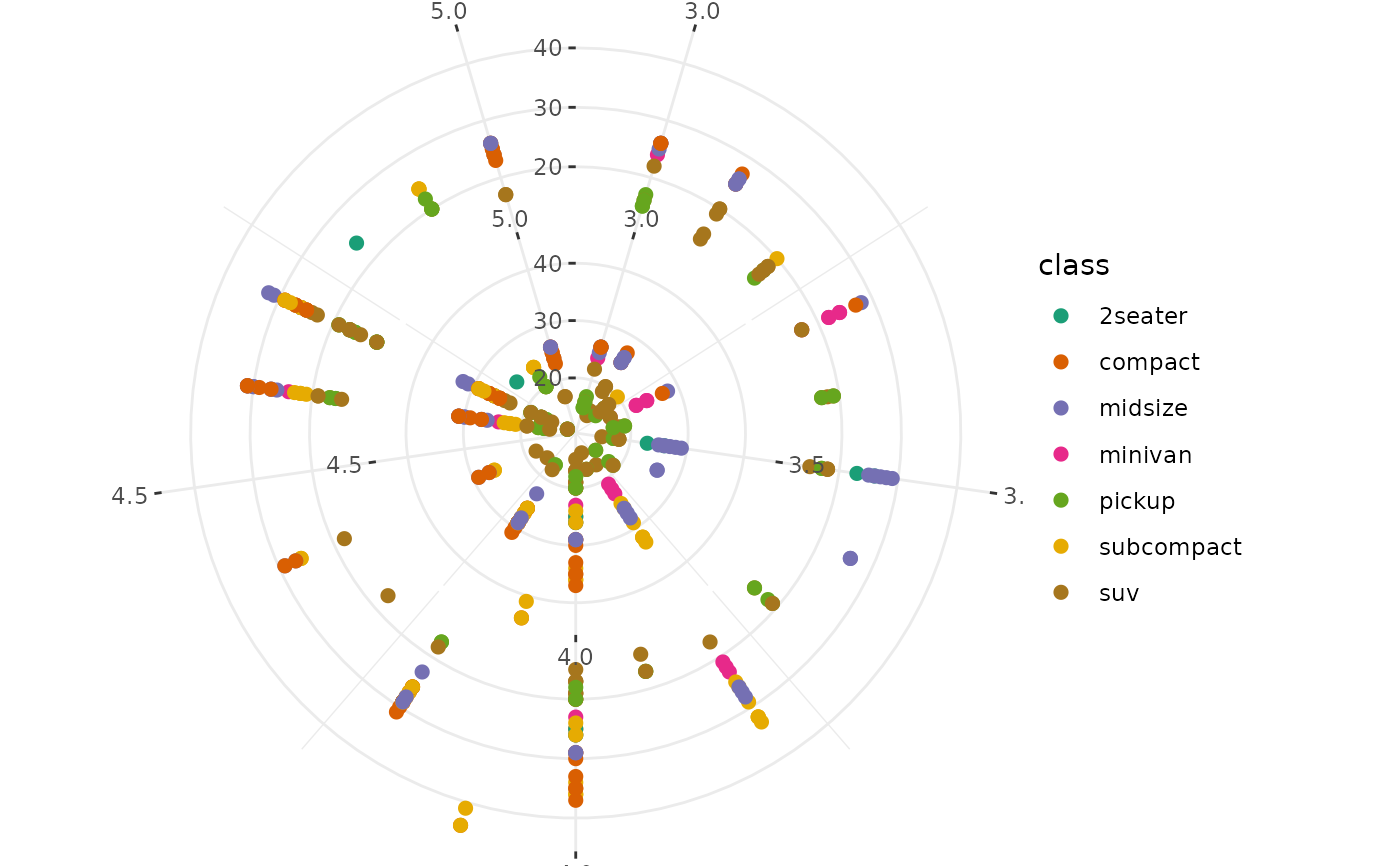
 # circle_continuous()
circle_continuous(mpg, limits = continuous_limits(c(3, 5))) +
ggalign(mapping = aes(displ, hwy, colour = class)) +
geom_point(size = 2) +
ggalign(mapping = aes(displ, hwy, colour = class)) +
geom_point(size = 2) &
scale_color_brewer(palette = "Dark2") &
theme_bw()
