As discussed in vignette("heatmap-layout"), the
ggheatmap() function is a specialized form of
quad_layout(). Specifically, it is a variant of
quad_alignb(), which aligns observations both horizontally
and vertically.
quad_layout() arranges plots in the Quad-Side of a main
plot. Depending on whether you want to align observations in the
horizontal or vertical direction, there are
four main types of quad_layout(): -
quad_free/ggside: Never align observations. -
quad_alignh: Align observations in the horizontal
direction. - quad_alignv: Align observations in the
vertical direction. - quad_alignb: Align observations in
both horizontal and vertical directions.
quad_free()
quad_free() won’t align observations.
ggside() is an alias of quad_free(). It do the
same function of ggside packge. This
is particularly useful for metadata for summary graphics on a continuous
axis
input data
Like ggplot, you’ll need to provide input that can be
converted into a data frame. Internally, the
fortify_data_frame() function is used to handle this
conversion.
ggside(mpg) +
    geom_point(aes(displ, hwy, colour = class))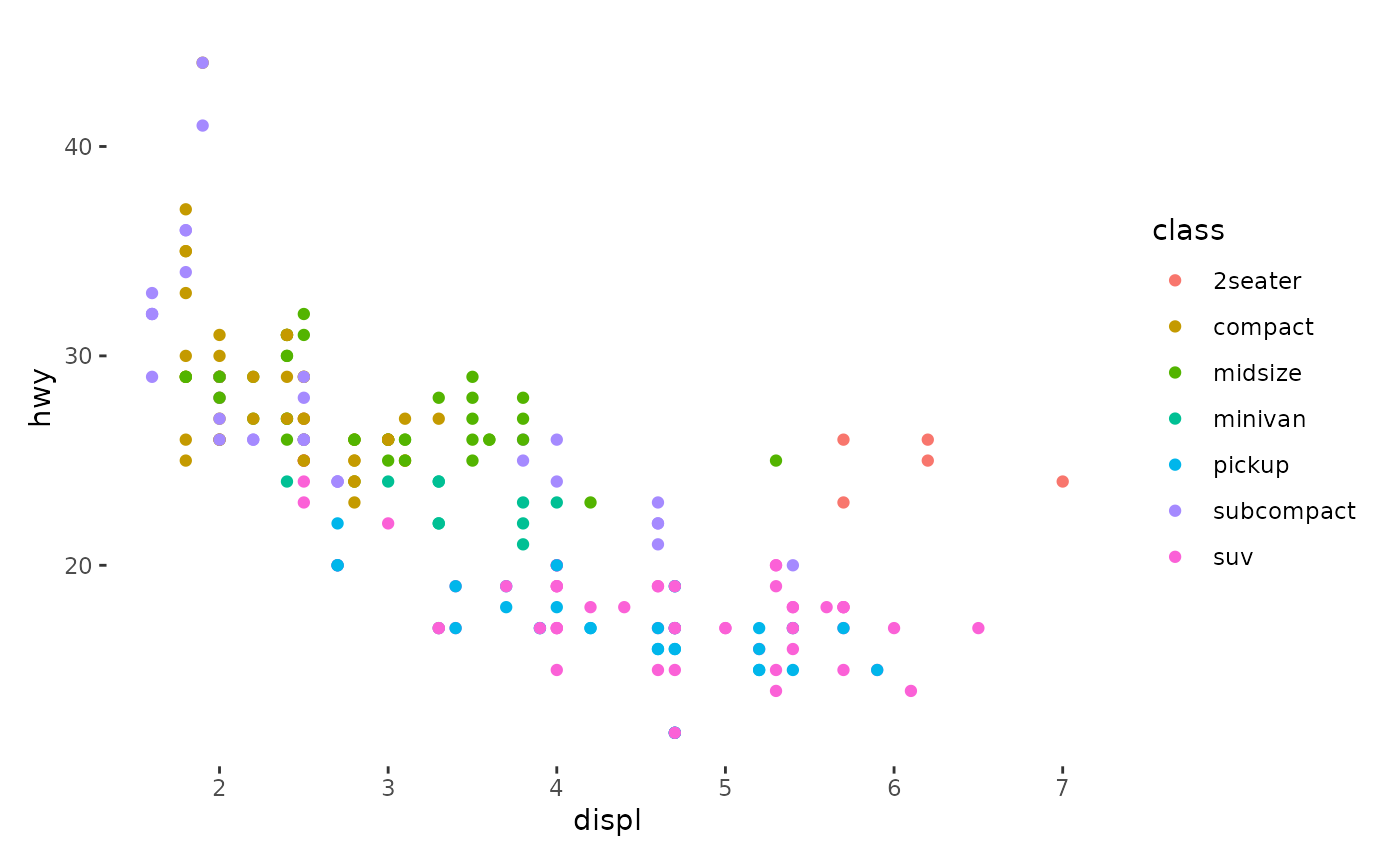
annotation
Like ggheatmap(), annotations in
quad_free() can be placed at the top, left, bottom, and
right sides, but all annotations here use stack_free(),
meaning they don’t align observations. The data will be directly
inherited which is different from the
quad_alignb()/quad_alignh()/quad_alignv()
where the column annotation will transpose the layout matrix.
Additionally, annotations stack_layout() can be manually
added directly, I’ll demonstrate it in
quad_alignh()/quad_alignv() section where
manual initialization is required.
ggside(mpg, aes(displ, hwy, colour = class)) -
    # set default theme for all plots in the layout
    scheme_theme(theme_bw()) +
    geom_point(size = 2) +
    # add top annotation
    anno_top(size = 0.3) -
    # set default theme for the top annotation
    scheme_theme(theme_no_axes("tb")) +
    # add a plot in the top annotation
    ggfree() +
    geom_density(aes(displ, y = after_stat(density), colour = class), position = "stack") +
    # add right annotation
    anno_right(size = 0.3) -
    # set default theme for the right annotation
    scheme_theme(theme_no_axes("lr")) +
    # add a plot in the right annotation
    ggfree() +
    geom_density(aes(x = after_stat(density), hwy, colour = class),
        position = "stack"
    ) +
    theme(axis.text.x = element_text(angle = 90, vjust = .5))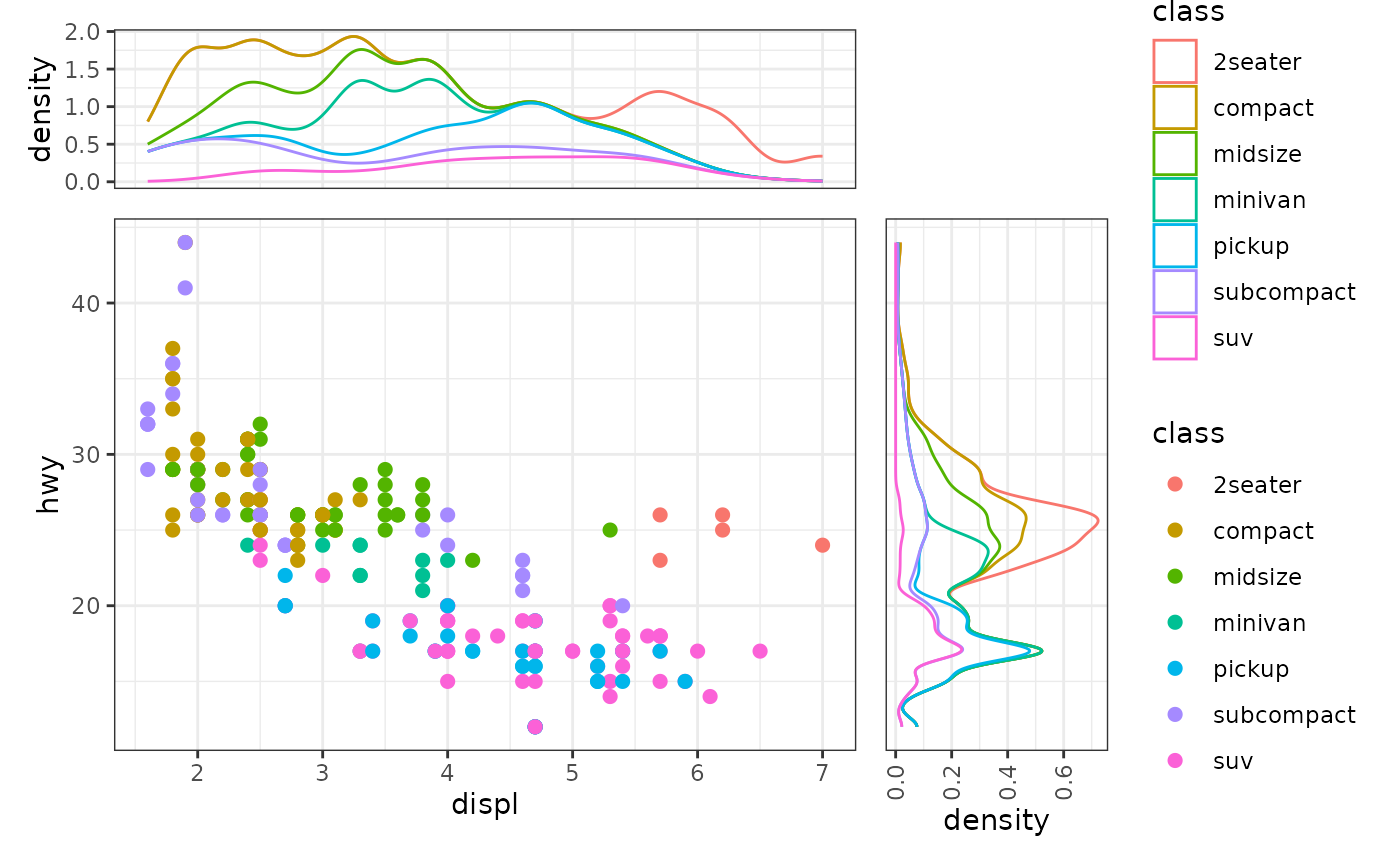
Unlike ggheatmap()/heatmap_layout(),
ggside()/quad_free() allows facetting for the
main plot, which should also be applied to the annotations for proper
alignment.
i2 <- iris
i2$Species2 <- rep(c("A", "B"), 75)
ggside(i2, aes(Sepal.Width, Sepal.Length, color = Species)) -
    # set default theme for all plots in the layout
    scheme_theme(theme_bw()) +
    geom_point(size = 2) +
    facet_grid(Species ~ Species2) +
    # add top annotation
    anno_top(size = 0.3) -
    # set default theme for the top annotation
    scheme_theme(theme_no_axes("tb")) +
    # add a plot in the top annotation
    ggfree() +
    geom_density(aes(Sepal.Width, y = after_stat(density), colour = Species),
        position = "stack"
    ) -
    # we can utilize the `-` to set facet for all plots in the annotation
    facet_grid(cols = vars(Species2)) +
    # add right annotation
    anno_right(size = 0.3) -
    # set default theme for the right annotation
    scheme_theme(theme_no_axes("lr")) +
    # add a plot in the right annotation
    ggfree() +
    geom_density(aes(x = after_stat(density), Sepal.Length, colour = Species),
        position = "stack"
    ) +
    theme(axis.text.x = element_text(angle = 90, vjust = .5)) -
    # we can utilize the `-` to set facet for all plots in the annotation
    facet_grid(rows = vars(Species))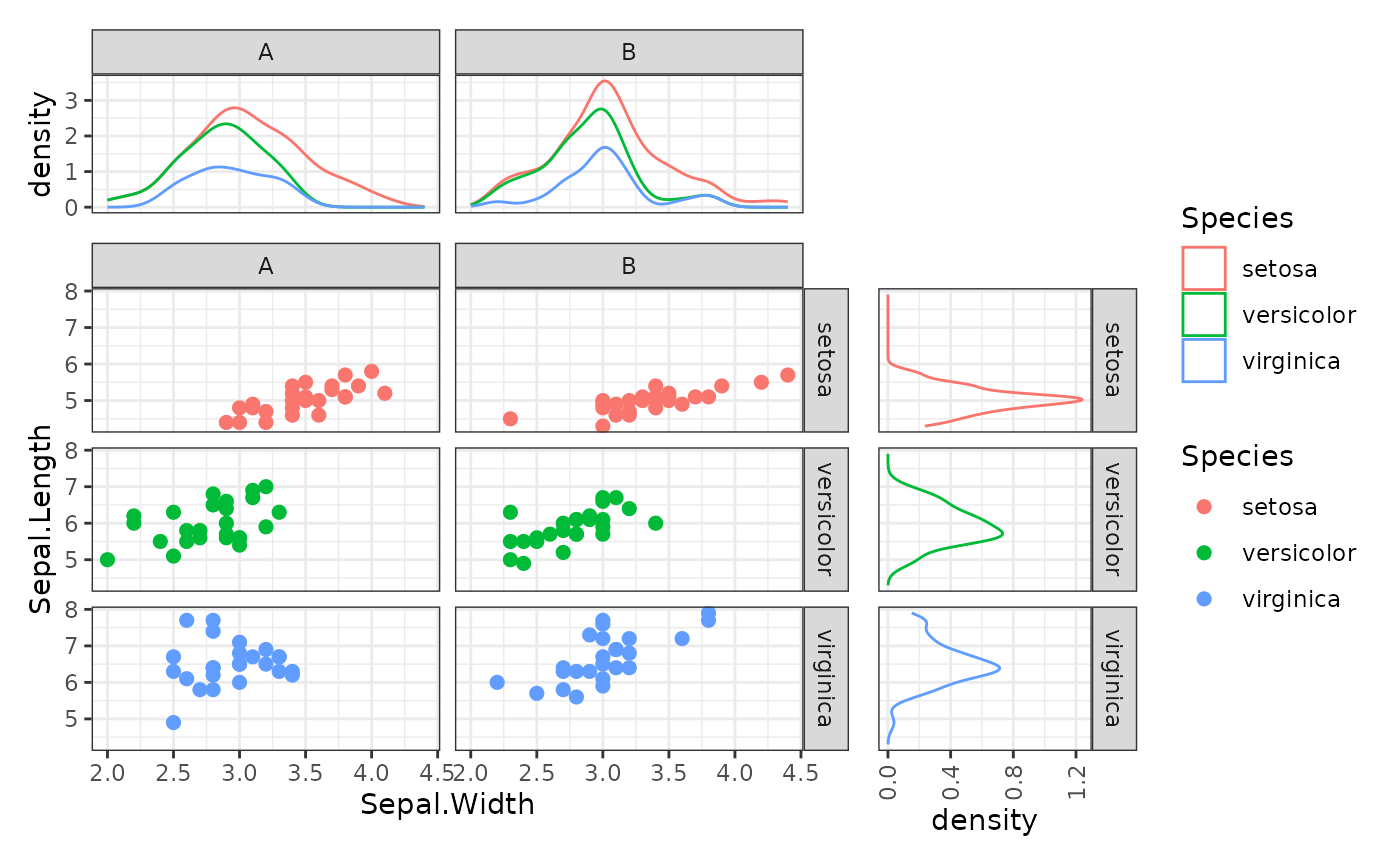
quad_alignh()/quad_alignv()
quad_alignh() aligns observations horizontally, while
quad_alignv() aligns observations vertically.
input data
To align observations in the horizontal/vertical direction, you’ll
need to provide input that can be converted into a matrix. Internally,
the fortify_matrix() function is used to handle this
conversion, ensuring the input is in the correct format for
alignment.
The underlying ggplot data is the same with
ggheatmap()/heatmap_layout(), it is
recommended to use .y, or .row_names as the
y mapping in the main plot for quad_alignh()
but use .x or .column_names as the
x mapping in the main plot for
quad_alignv().
set.seed(123)
small_mat <- matrix(rnorm(56), nrow = 8)
rownames(small_mat) <- paste0("row", seq_len(nrow(small_mat)))
colnames(small_mat) <- paste0("column", seq_len(ncol(small_mat)))
# we'll align the horizontal direction
quad_alignh(small_mat) +
    geom_boxplot(aes(value, .row_names, fill = .row_names)) +
    scale_fill_brewer(palette = "Dark2")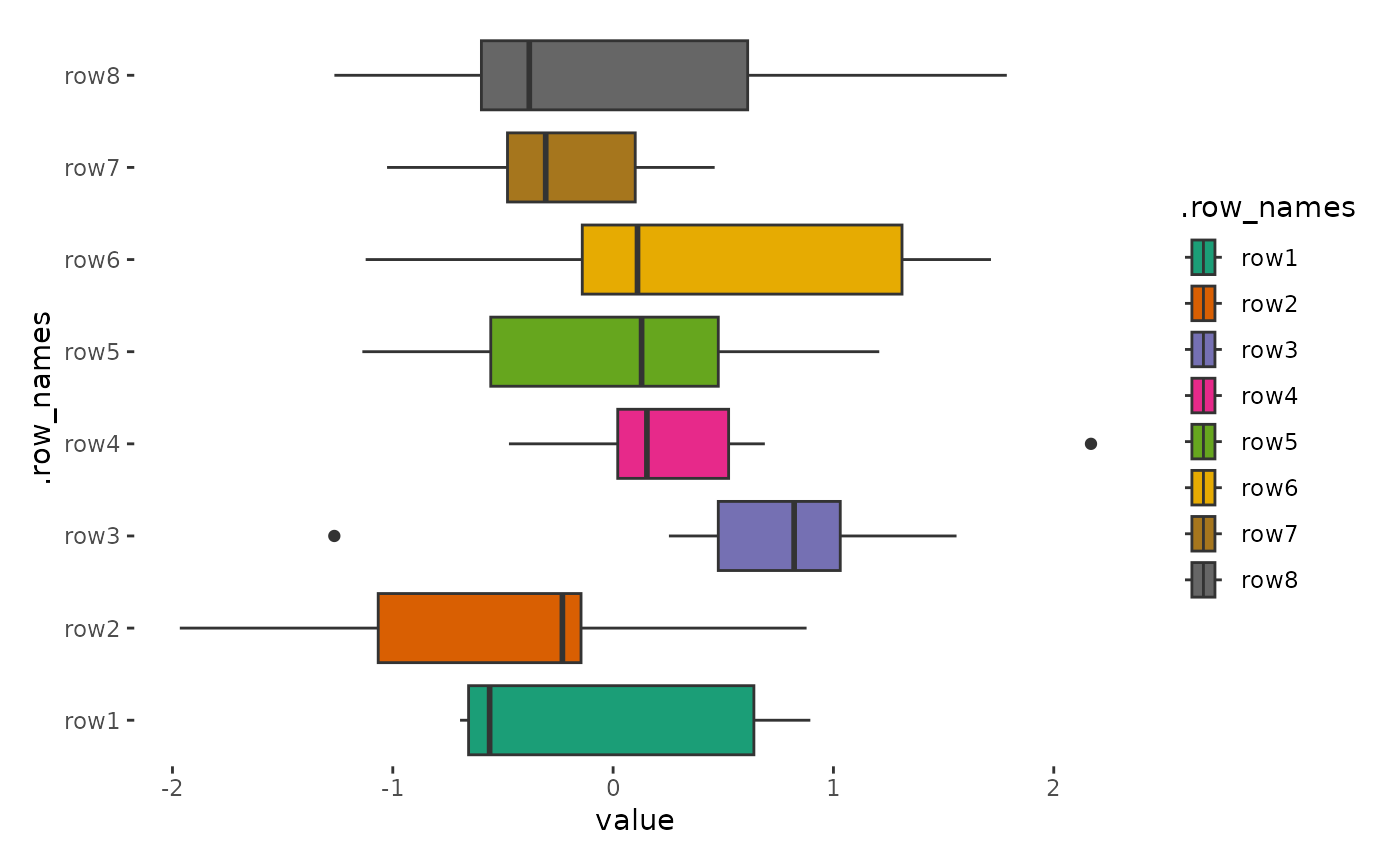
# we'll align the vertical direction
quad_alignv(small_mat) +
    geom_boxplot(aes(.column_names, value, fill = .column_names)) +
    scale_fill_brewer(palette = "Dark2")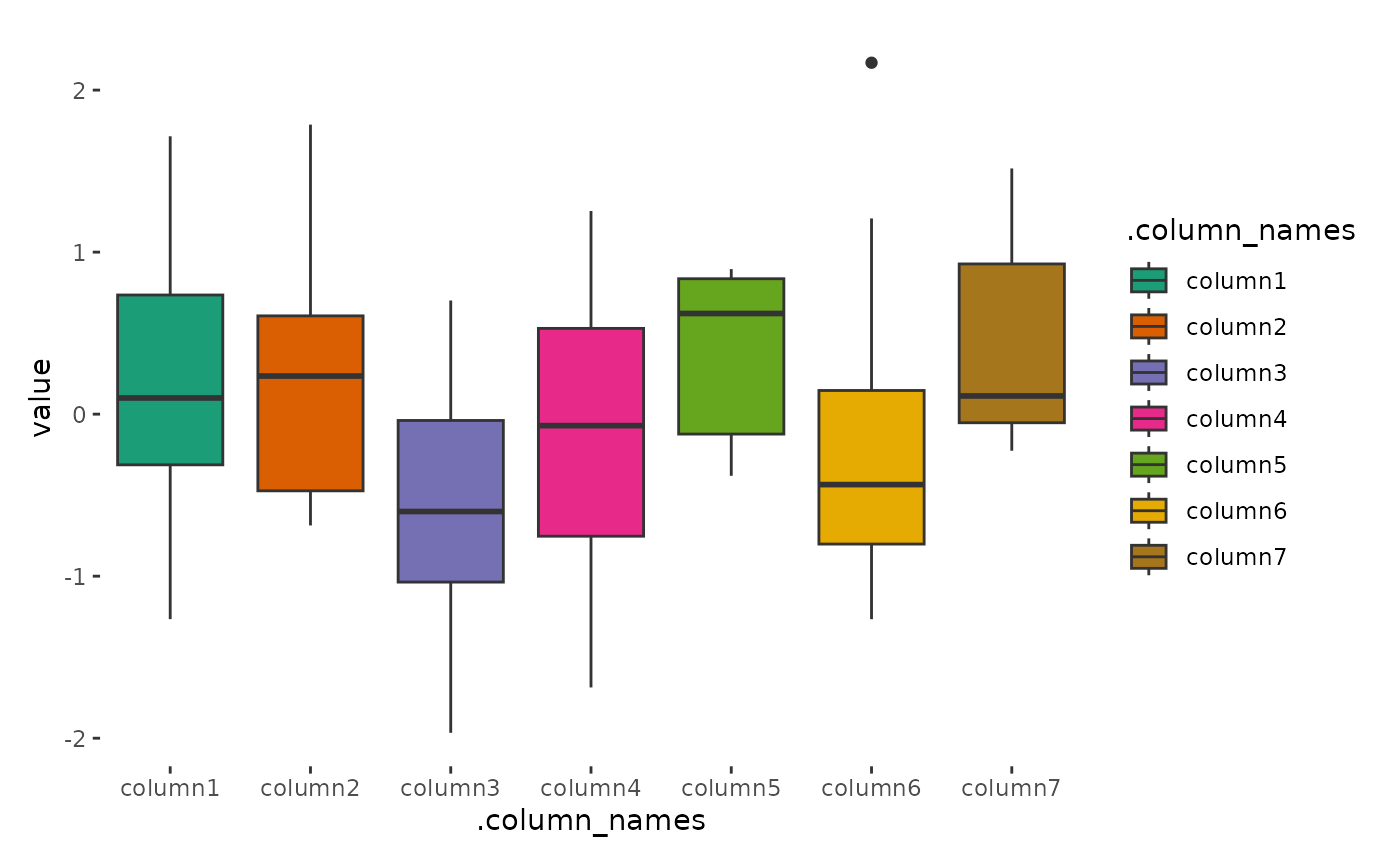
annotation
the same with ggheatmap()/heatmap_layout(),
we can add annotation in top, left, bottom, and right side. but the top
and bottom annotation in quad_alignh() is a
stack_free() which won’t align observations and left and
right annotation in quad_alignv() is a
stack_free() which won’t align observations.
For left and right annotation in quad_alignh(), they are
a stack_align() layout which will align observations, and
require a matrix in the layout data. So it can inherit from the parent
quad_layout() and we can add both ggalign()
and ggfree() and other align_*() functions to
the annotation.
quad_alignh(small_mat) +
    geom_boxplot(aes(value, .row_names, fill = .row_names)) +
    scale_fill_brewer(palette = "Dark2") +
    anno_left() +
    align_dendro()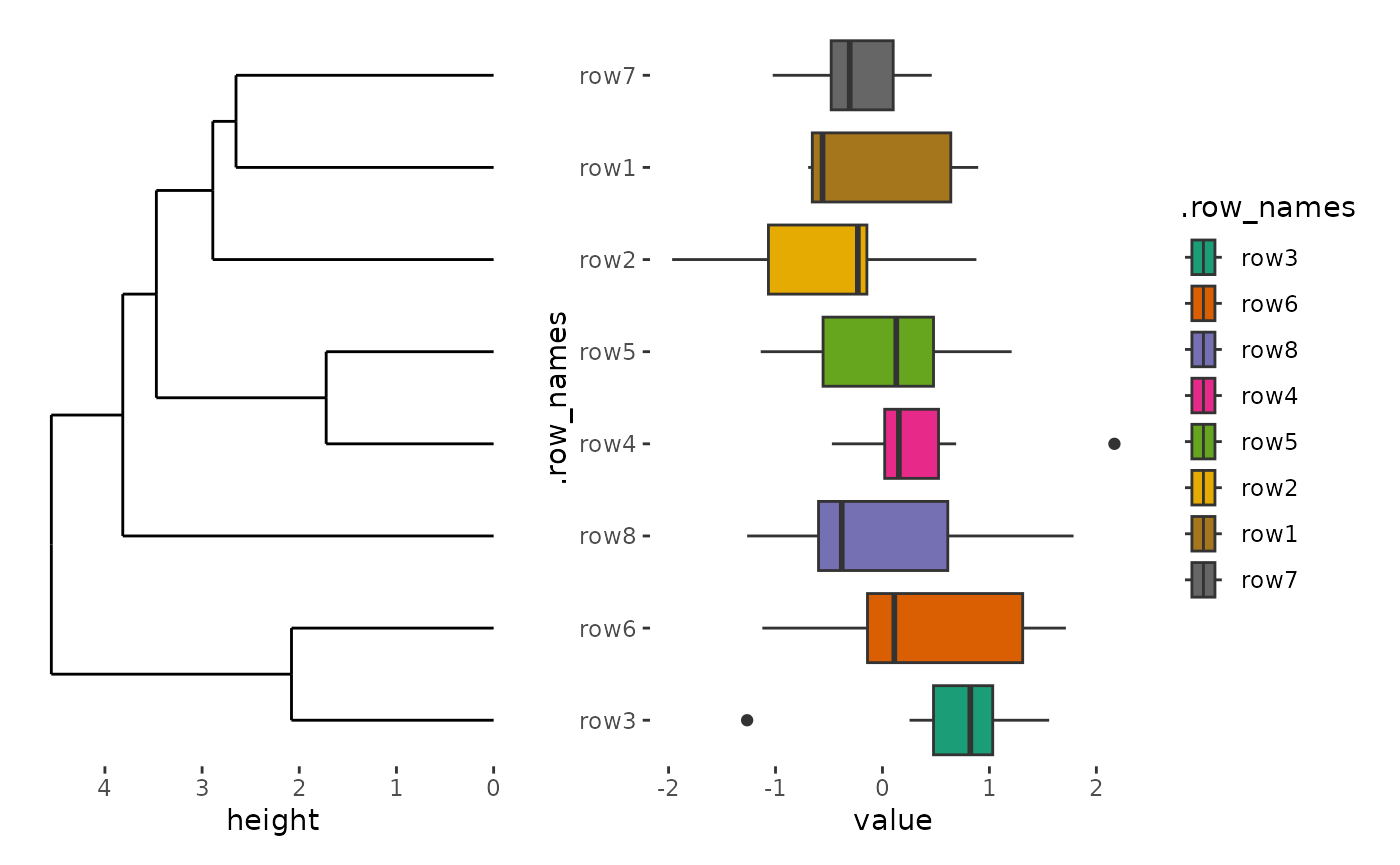
For top and bottom annotation in quad_alignh(), they are
a stack_free() which won’t align observations, and require
a data frame in the layout data. In this way, the annotation stack won’t
be initialized, resulting in a warning message.
quad_alignh(small_mat) +
    geom_boxplot(aes(value, .row_names, fill = .row_names)) +
    scale_fill_brewer(palette = "Dark2") +
    anno_top()
#> Warning: `data` in `quad_alignh()` is a double matrix, but the top annotation stack need
#> a <data.frame>, won't initialize the top annotation stack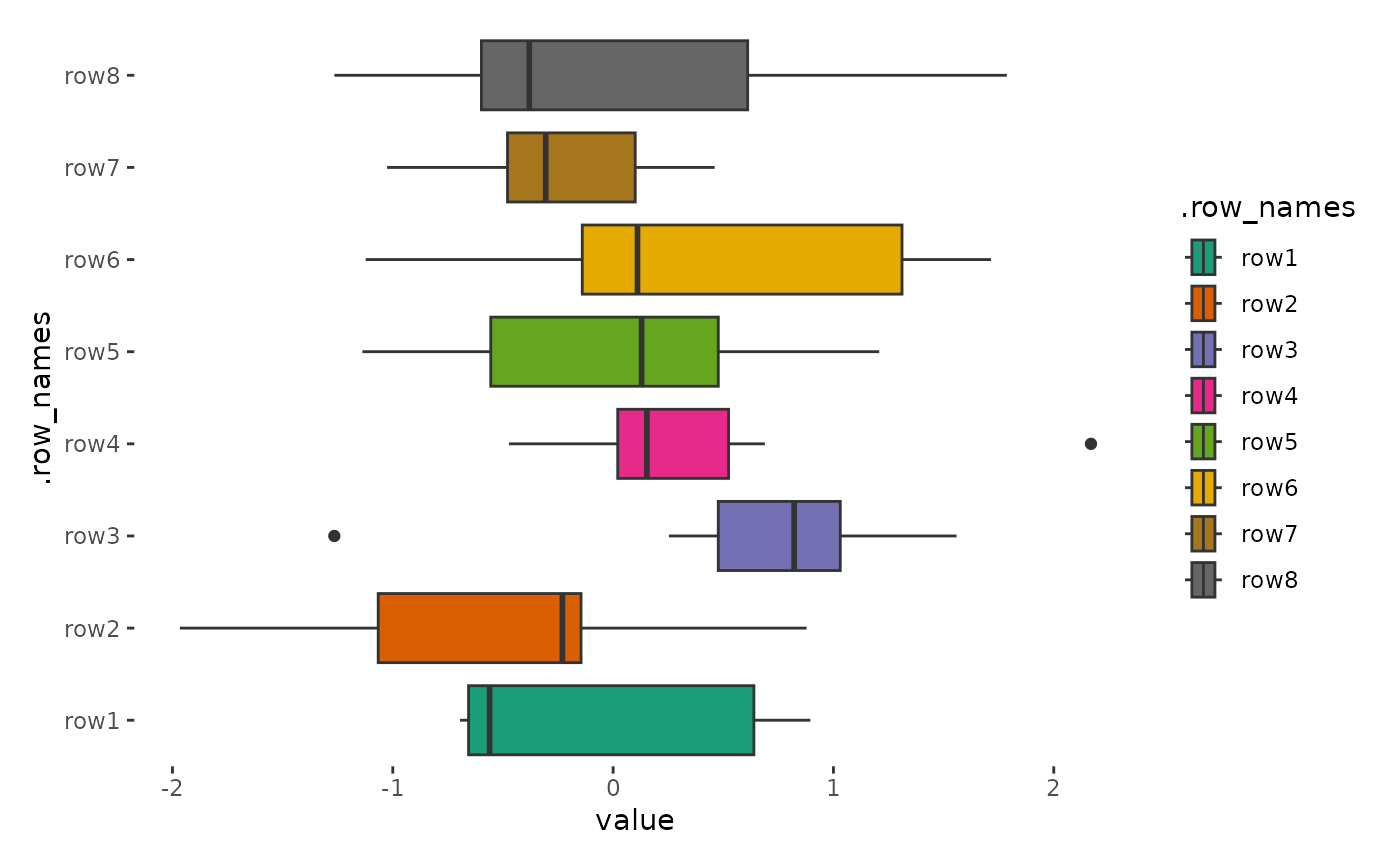
Manual adding of a stack_layout() is required in such
cases, you can set initialize = FALSE to prevent the
warning message.
quad_alignh(small_mat) +
    geom_boxplot(aes(value, .row_names, fill = .row_names)) +
    scale_fill_brewer(palette = "Dark2") +
    anno_top(initialize = FALSE) +
    # initialize the top annotation with a self-provided `stack_layout()`
    stack_freev(mpg) +
    # add a plot in the top annotation
    ggfree(aes(displ, hwy, colour = class)) +
    geom_point(aes(displ, hwy, colour = class))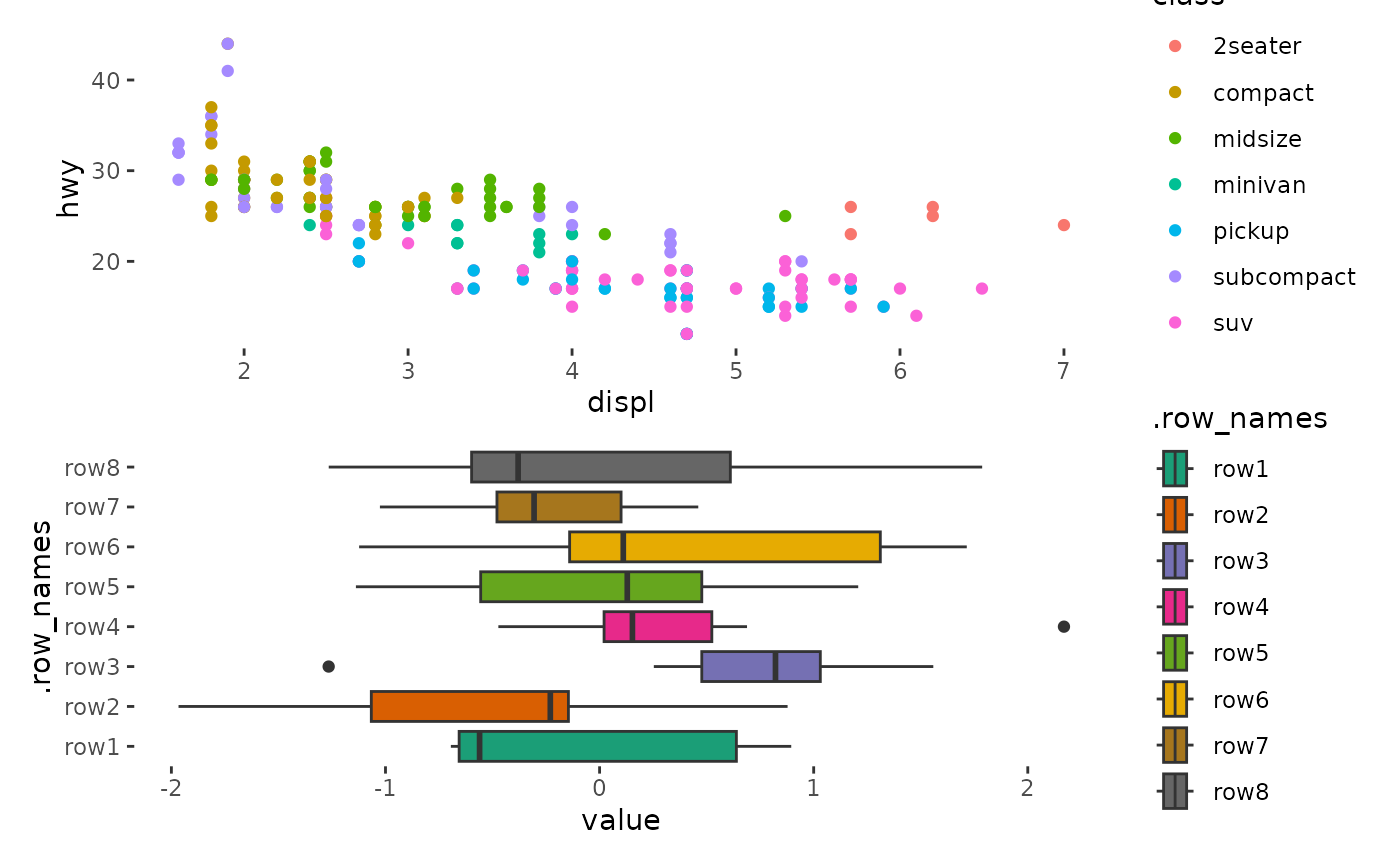
Alternatively, you can set initialize = TRUE, which will
initialize the annotation stack layout with no data. In this case, you
must provide data in each plot within the annotation.
quad_alignh(small_mat) +
    geom_boxplot(aes(value, .row_names, fill = .row_names)) +
    scale_fill_brewer(palette = "Dark2") +
    anno_top(initialize = TRUE) +
    # add a plot in the top annotation
    ggfree(data = mpg, aes(displ, hwy, colour = class)) +
    geom_point(aes(displ, hwy, colour = class))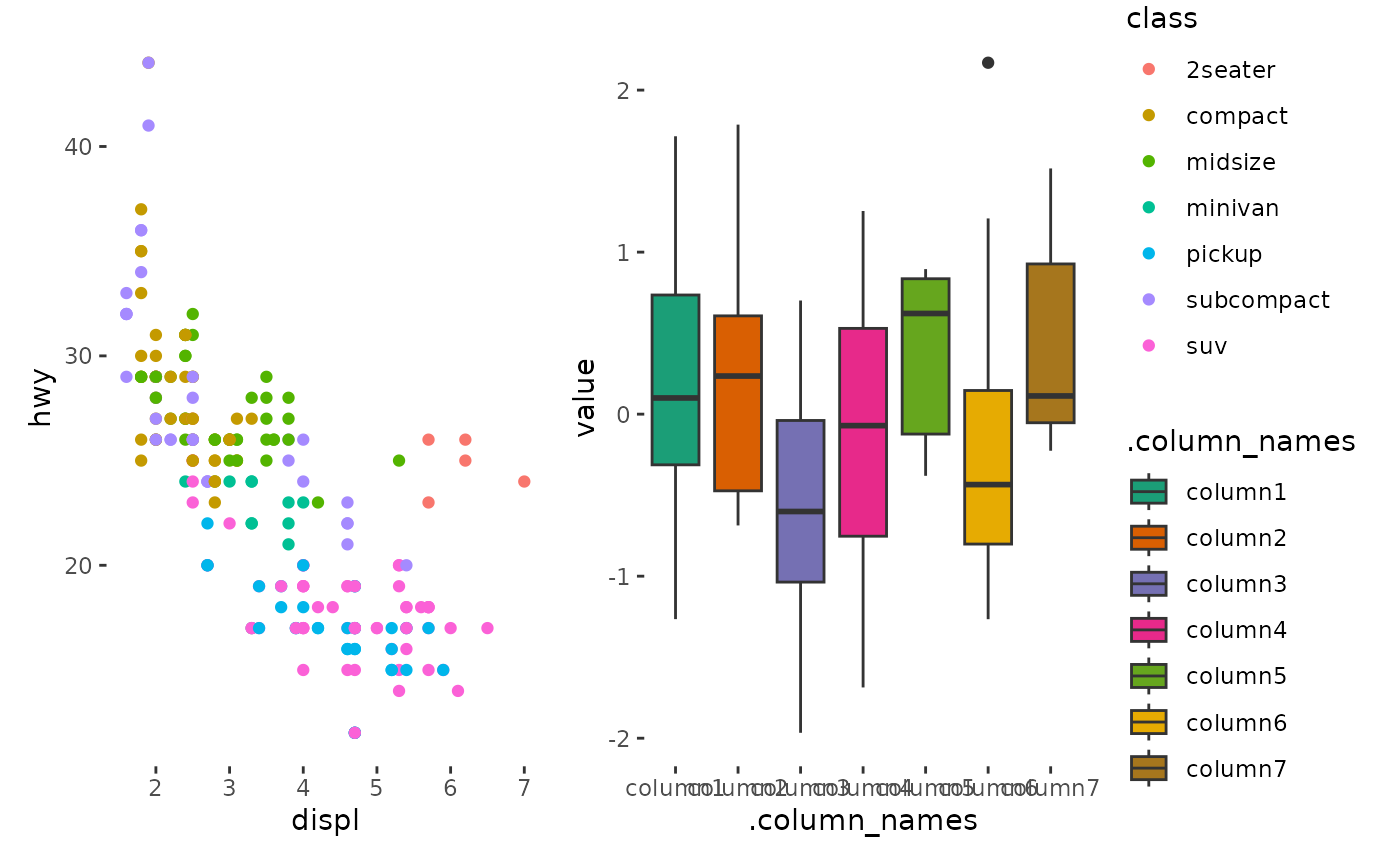
The same with quad_alignh(), we need to manually
initialize the left and right annotations in
quad_alignv().
quad_alignv(small_mat) +
    geom_boxplot(aes(.column_names, value, fill = .column_names)) +
    scale_fill_brewer(palette = "Dark2") +
    anno_left(initialize = FALSE) +
    # initialize the left annotation with a self-provided `stack_layout()`
    stack_free(data = mpg) +
    # add a plot in the top annotation
    ggfree(aes(displ, hwy, colour = class)) +
    geom_point(aes(displ, hwy, colour = class))
#> Warning: The `direction` argument of `stack_free()` must be provided as of ggalign
#> 0.0.5.
#> ℹ no default value of 'direction' argument in the next release
#> ℹ The deprecated feature was likely used in the ggalign package.
#>   Please report the issue at <https://github.com/Yunuuuu/ggalign/issues>.
#> This warning is displayed once every 8 hours.
#> Call `lifecycle::last_lifecycle_warnings()` to see where this warning was
#> generated.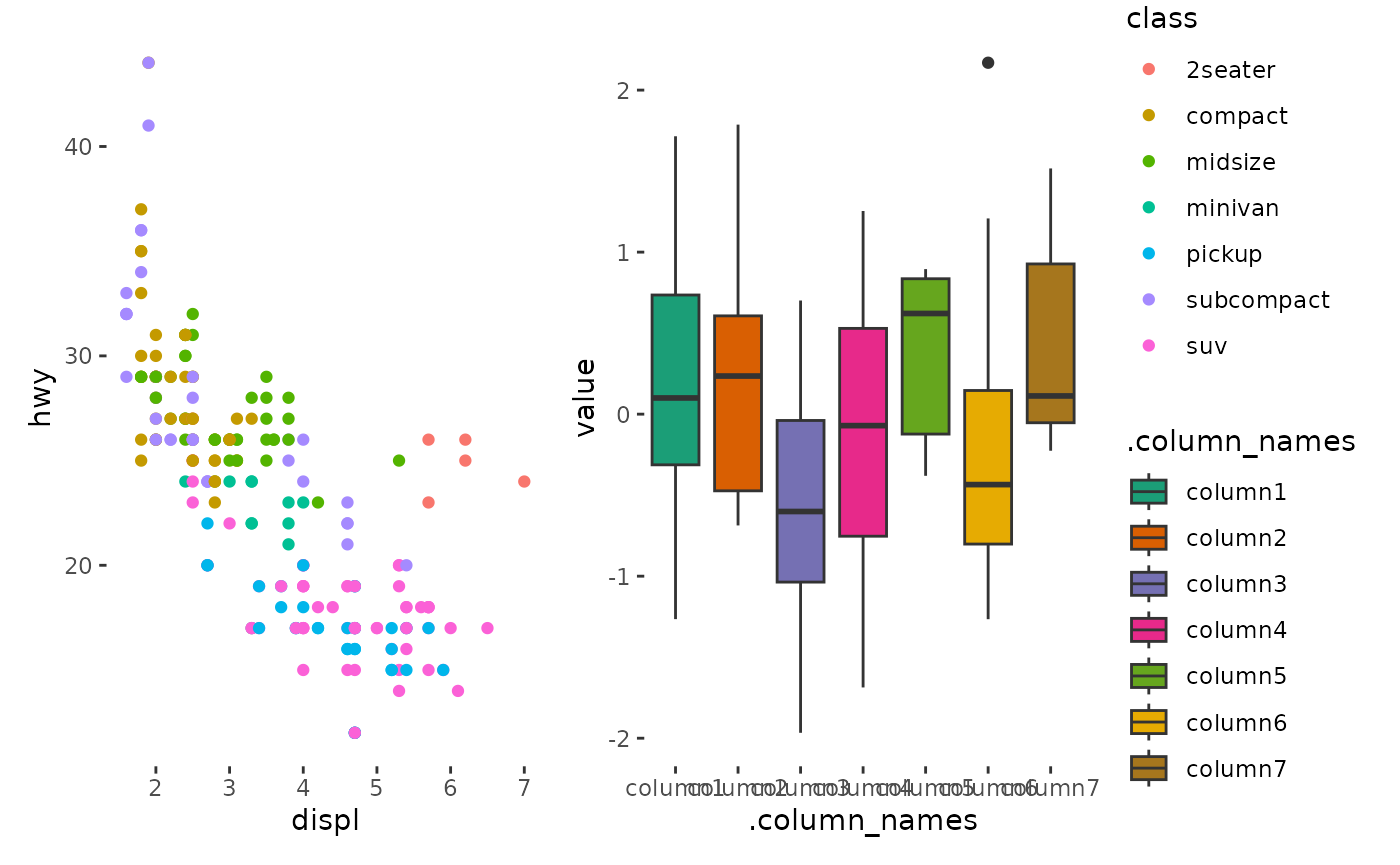
quad_alignb()
quad_alignb aligns observations in both horizontal and
vertical directions. It is a base version of
ggheatmap()/heatmap_layout(), it won’t add the
main plot geoms and default mapping automatically.
Session information
sessionInfo()
#> R version 4.4.2 (2024-10-31)
#> Platform: x86_64-pc-linux-gnu
#> Running under: Ubuntu 22.04.5 LTS
#>
#> Matrix products: default
#> BLAS:   /usr/lib/x86_64-linux-gnu/openblas-pthread/libblas.so.3
#> LAPACK: /usr/lib/x86_64-linux-gnu/openblas-pthread/libopenblasp-r0.3.20.so;  LAPACK version 3.10.0
#>
#> locale:
#>  [1] LC_CTYPE=C.UTF-8       LC_NUMERIC=C           LC_TIME=C.UTF-8
#>  [4] LC_COLLATE=C.UTF-8     LC_MONETARY=C.UTF-8    LC_MESSAGES=C.UTF-8
#>  [7] LC_PAPER=C.UTF-8       LC_NAME=C              LC_ADDRESS=C
#> [10] LC_TELEPHONE=C         LC_MEASUREMENT=C.UTF-8 LC_IDENTIFICATION=C
#>
#> time zone: UTC
#> tzcode source: system (glibc)
#>
#> attached base packages:
#> [1] stats     graphics  grDevices utils     datasets  methods   base
#>
#> other attached packages:
#> [1] ggalign_0.0.5.9000 ggplot2_3.5.1
#>
#> loaded via a namespace (and not attached):
#>  [1] gtable_0.3.6       jsonlite_1.8.9     crayon_1.5.3       dplyr_1.1.4
#>  [5] compiler_4.4.2     tidyselect_1.2.1   jquerylib_0.1.4    systemfonts_1.1.0
#>  [9] scales_1.3.0       textshaping_0.4.1  yaml_2.3.10        fastmap_1.2.0
#> [13] R6_2.5.1           labeling_0.4.3     generics_0.1.3     knitr_1.49
#> [17] tibble_3.2.1       desc_1.4.3         munsell_0.5.1      bslib_0.8.0
#> [21] pillar_1.9.0       RColorBrewer_1.1-3 rlang_1.1.4        utf8_1.2.4
#> [25] cachem_1.1.0       xfun_0.49          fs_1.6.5           sass_0.4.9
#> [29] cli_3.6.3          pkgdown_2.1.1      withr_3.0.2        magrittr_2.0.3
#> [33] digest_0.6.37      grid_4.4.2         lifecycle_1.0.4    vctrs_0.6.5
#> [37] evaluate_1.0.1     glue_1.8.0         farver_2.1.2       ragg_1.3.3
#> [41] fansi_1.0.6        colorspace_2.1-1   rmarkdown_2.29     tools_4.4.2
#> [45] pkgconfig_2.0.3    htmltools_0.5.8.1