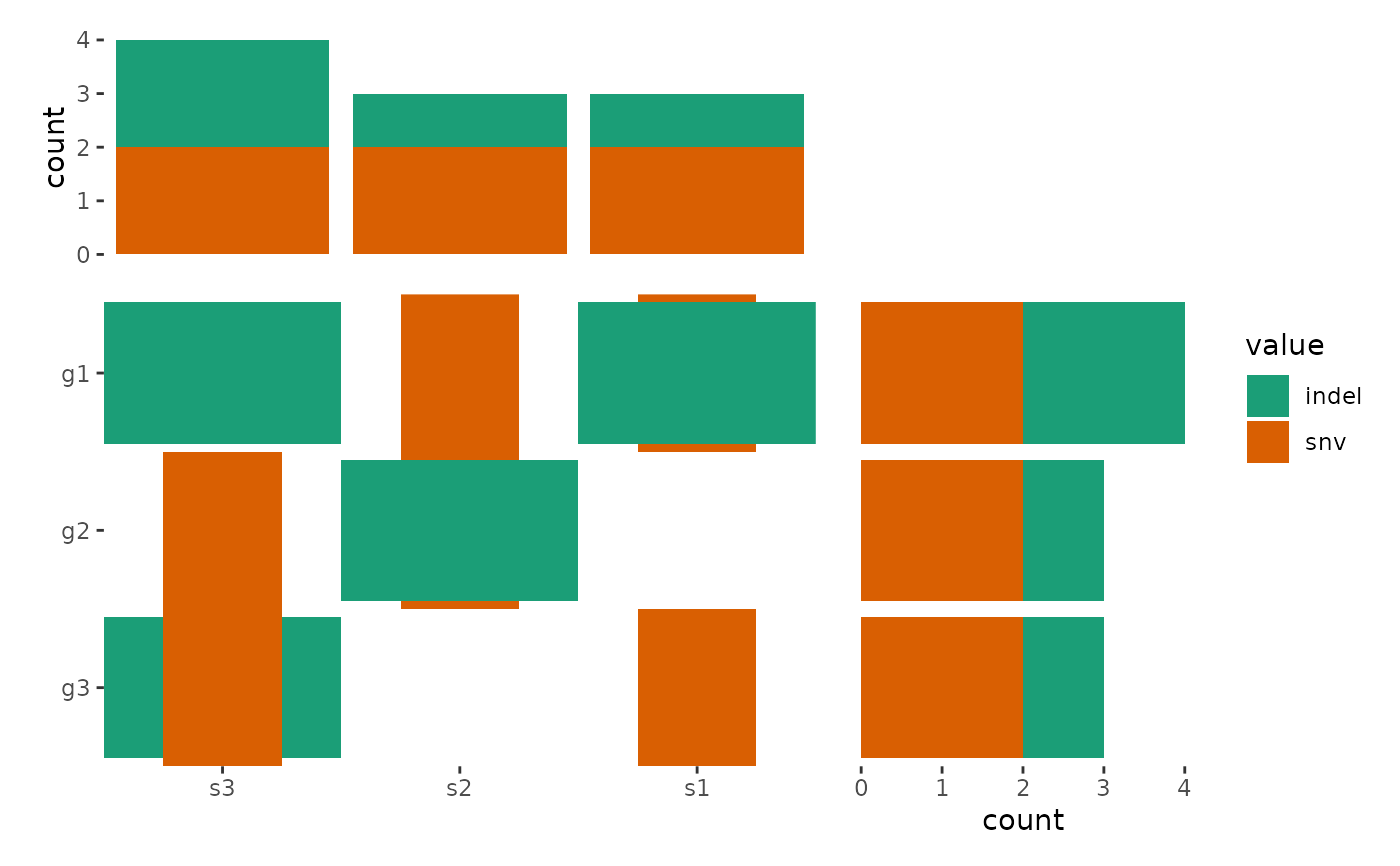
The ggoncoplot() function generates oncoPrint visualizations that display
genetic alterations in a matrix format. This function is especially useful
for visualizing complex genomic data, such as mutations, copy number
variations, and other genomic alterations in cancer research.
Usage
ggoncoplot(
  data = NULL,
  mapping = aes(),
  ...,
  map_width = NULL,
  map_height = NULL,
  reorder_row = reorder_column,
  reorder_column = TRUE,
  remove_duplicates = FALSE,
  width = NA,
  height = NA,
  filling = waiver(),
  theme = NULL,
  active = NULL
)

# Default S3 method
ggoncoplot(
  data = NULL,
  mapping = aes(),
  ...,
  map_width = NULL,
  map_height = NULL,
  reorder_row = reorder_column,
  reorder_column = TRUE,
  remove_duplicates = FALSE,
  width = NA,
  height = NA,
  filling = waiver(),
  theme = NULL,
  active = NULL
)
Arguments
- data
A character matrix which encodes the alterations, you can use
";",":",",", or"|"to separate multiple alterations.- mapping
Default list of aesthetic mappings to use for main plot in the layout. If not specified, must be supplied in each layer added to the main plot.
- ...
Additional arguments passed to
fortify_matrix().- map_width, map_height
A named numeric value defines the width/height of each alterations.
- reorder_row
A boolean value indicating whether to reorder the rows based on the frequency of alterations. You can set this to
FALSE, then addalign_order(~rowSums(!is.na(.x)), reverse = TRUE)to achieve the same result. You may also need to setstrit = FALSEinalign_order()if there are already groups.- reorder_column
A boolean value indicating whether to reorder the columns based on the characteristics of the alterations. You can set this to
FALSE, then addalign_order2(memo_order)to achieve the same result. You may also need to setstrit = FALSEinalign_order2()if there are already groups.- remove_duplicates
A logical value indicating whether to remove duplicated variants within the same cell.
- width, height
The relative width/height of the main plot, can be a
unitobject.- filling
Same as
ggheatmap(), but only"tile"can be used.- theme
A
theme()object used to customize various elements of the layout, includingguides,title,subtitle,caption,margins,panel.border, andbackground. By default, the theme will inherit from the parentlayout. It also controls the panel spacing for all plots in the layout.- active
A
active()object that defines the context settings when added to a layout.
Details
ggoncoplot() is a wrapper around the ggheatmap() function, designed to
simplify the creation of OncoPrint-style visualizations. The function
automatically processes the input character matrix by splitting the encoded
alterations (delimited by ";", ":", ",", or "|") into
individual genomic events and unnesting the columns for visualization.
Examples
# A simple example from `ComplexHeatmap`
mat <- read.table(textConnection(
    "s1,s2,s3
g1,snv;indel,snv,indel
g2,,snv;indel,snv
g3,snv,,indel;snv"
), row.names = 1, header = TRUE, sep = ",", stringsAsFactors = FALSE)

ggoncoplot(mat, map_width = c(snv = 0.5), map_height = c(indel = 0.9)) +
    guides(fill = "none") +
    anno_top(size = 0.5) +
    ggalign() +
    geom_bar(aes(fill = value), data = function(x) {
        subset(x, !is.na(value))
    }) +
    anno_right(size = 0.5) +
    ggalign() +
    geom_bar(aes(fill = value), orientation = "y", data = function(x) {
        subset(x, !is.na(value))
    }) &
    scale_fill_brewer(palette = "Dark2", na.translate = FALSE)

