The plot_action() function defines the behavior of plots within a layout.
It can be used in the action argument of layout functions like hmanno()
or stack_active() to set global actions for all plots in the layout.
Additionally, plot_action() can be applied directly to specific plots
through the action argument in the align_*() functions, or it can be
added directly to a plot.
Arguments
- data
A function to transform the plot data before rendering. Defaults to
waiver(), which inherits from the parent layout. If no parent layout is specified, the default isNULL, meaning the data won't be modified. Use this hook to modify the data for allgeomsafter the layout is created but before rendering byggplot2. The data returned must be a data frame.- theme
Default plot theme: One of:
NULL: will inherit from the parent layout directly.theme(): will be added with the parent layout theme.
Note: Axis titles and labels that are parallel to the layout axis will always be removed by default. For vertical stack layouts, this refers to the x-axis; for horizontal stack layouts, this refers to the y-axis. To display these axis titles or labels, you must manually add the appropriate theme() elements for the parallel axis.
- guides
A string with one or more of
"t","l","b", and"r"indicating which side of guide legends should be collected. Defaults towaiver(), which inherits from the parent layout. If no parent layout, all guides will be collected. IfNULL, no guides will be aligned.- free_spaces
A string with one or more of
"t","l","b", and"r"indicating which border spaces should be removed. Defaults towaiver(), which inherits from the parent layout. If no parent, the default isNULL, meaning no spaces are removed.- free_labs
A string with one or more of
"t","l","b", and"r"indicating which axis titles should be free from alignment. Defaults towaiver(), which inherits from the parent layout. If no parent layout, no axis titles will be aligned. IfNULL, all axis titles will be aligned.
Examples
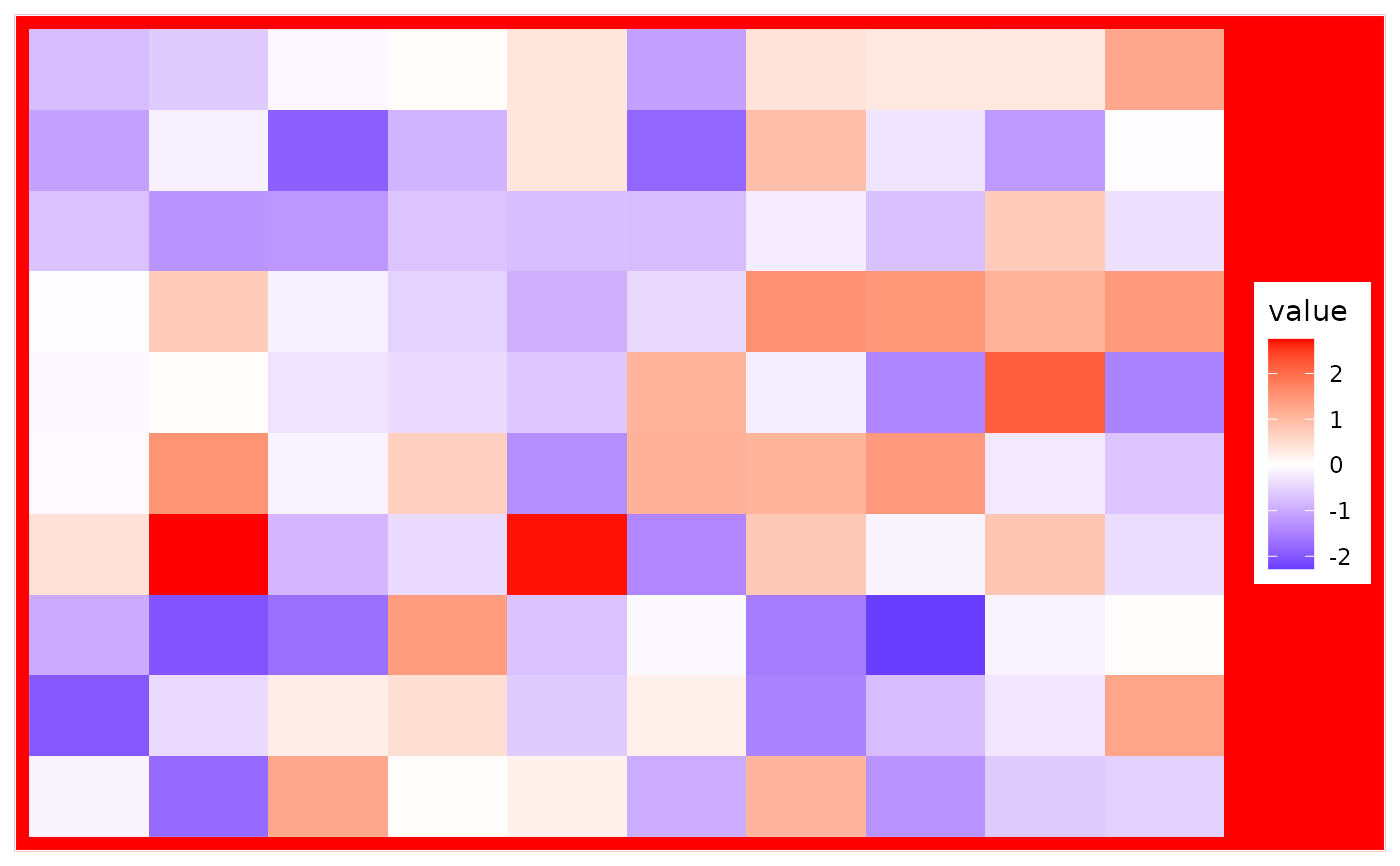
# used in the layout, define the default action for all plots in the layout
ggheatmap(matrix(rnorm(100L), nrow = 10),
action = plot_action(
theme = theme(plot.background = element_rect(fill = "red"))
)
)
#> → heatmap built with `geom_tile()`
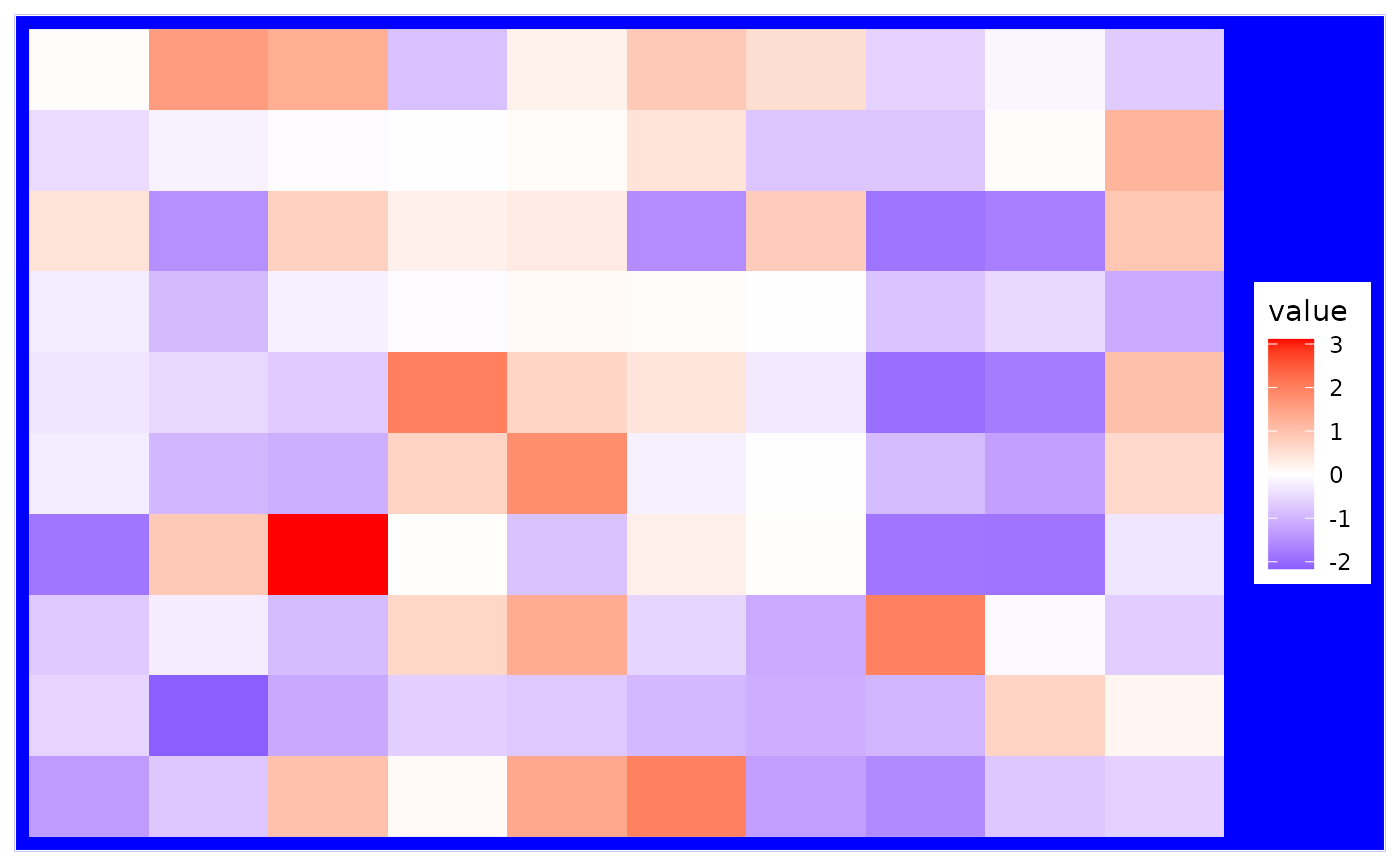
 # You can also add it for a single plot
ggheatmap(matrix(rnorm(100L), nrow = 10),
action = plot_action(
theme = theme(plot.background = element_rect(fill = "red"))
)
) + plot_action( # here, we modify the plot action for the heatmap body
theme = theme(plot.background = element_rect(fill = "blue"))
)
#> → heatmap built with `geom_tile()`
# You can also add it for a single plot
ggheatmap(matrix(rnorm(100L), nrow = 10),
action = plot_action(
theme = theme(plot.background = element_rect(fill = "red"))
)
) + plot_action( # here, we modify the plot action for the heatmap body
theme = theme(plot.background = element_rect(fill = "blue"))
)
#> → heatmap built with `geom_tile()`