stack_layout() arranges plots either horizontally or
vertically, and can be referred to using the alias
ggstack(). There are two types of stack layouts:
-
stack_align(): align the observations along the stack. -
stack_free(): don’t align the observations.
Several aliases are available for convenience:
-
stack_alignv: Aligns the stack vertically (special case ofstack_align()). -
stack_alignh: Aligns the stack horizontally (special case ofstack_align()). -
stack_freev: A vertical version ofstack_free(). -
stack_freeh: A horizontal version ofstack_free().direction = "horizontal".
Input data
- For
stack_free(), a data frame is required, and the input will be automatically converted usingfortify_data_frame()if needed. - For
stack_align(), a matrix is required, and the input will be automatically converted usingfortify_matrix()if needed.
set.seed(123)
small_mat <- matrix(rnorm(56), nrow = 7)
rownames(small_mat) <- paste0("row", seq_len(nrow(small_mat)))
colnames(small_mat) <- paste0("column", seq_len(ncol(small_mat)))
By default, stack_align()/stack_free() will
set up the layout, but no plot will be drawn until you add a plot
element:
stack_alignh(small_mat)
# stack_freev(small_mat) # the same for `stack_free()`plot element
For stack_align(), plots can be added regardless of
whether they need to align observations.
stack_alignh(small_mat) + align_dendro()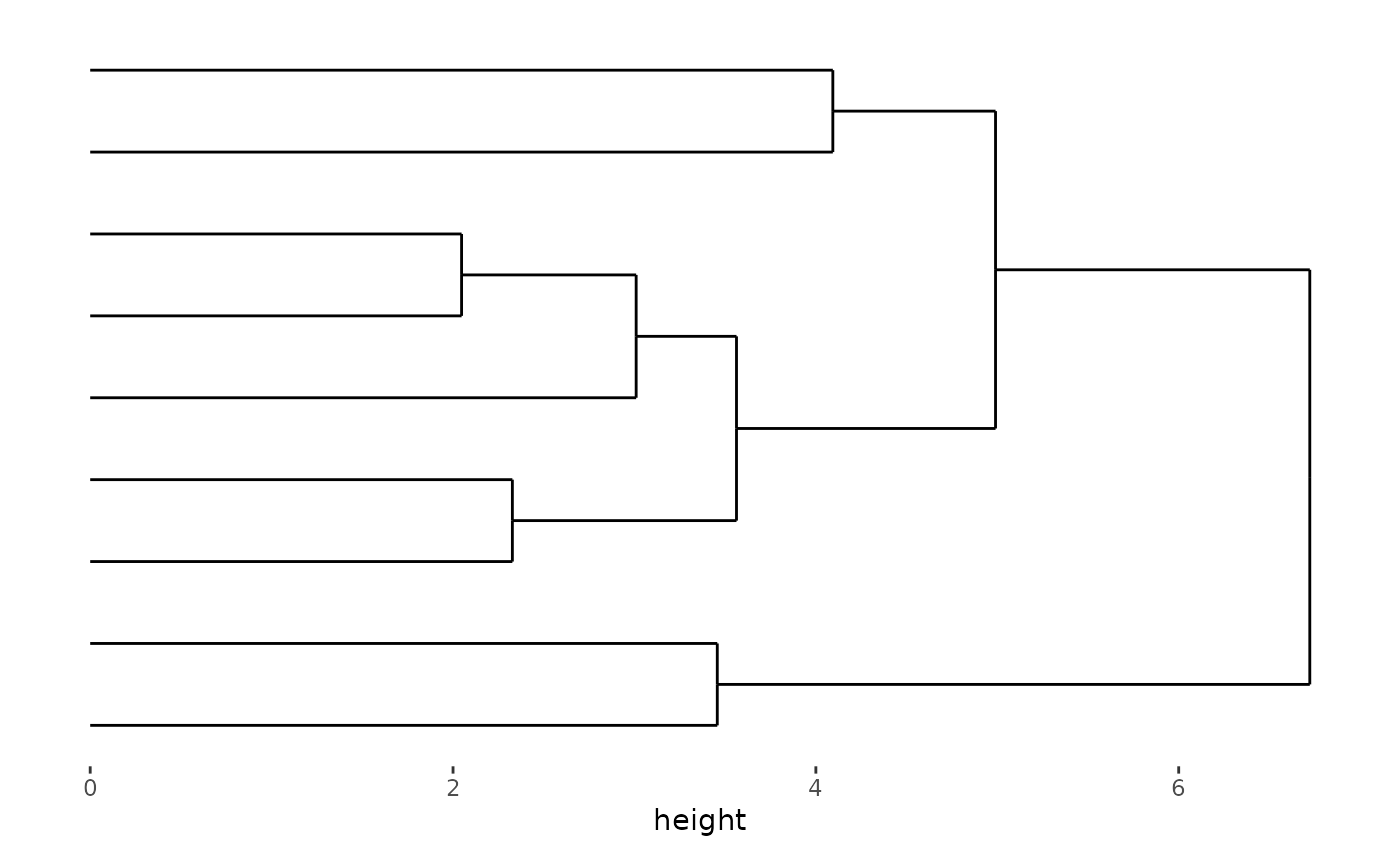
stack_alignh(small_mat) +
    align_kmeans(centers = 3L) +
    ggalign(data = rowSums) +
    geom_bar(aes(value, fill = .panel), orientation = "y", stat = "identity") +
    facet_grid(switch = "y") +
    theme(strip.text = element_text()) +
    align_dendro(aes(color = branch))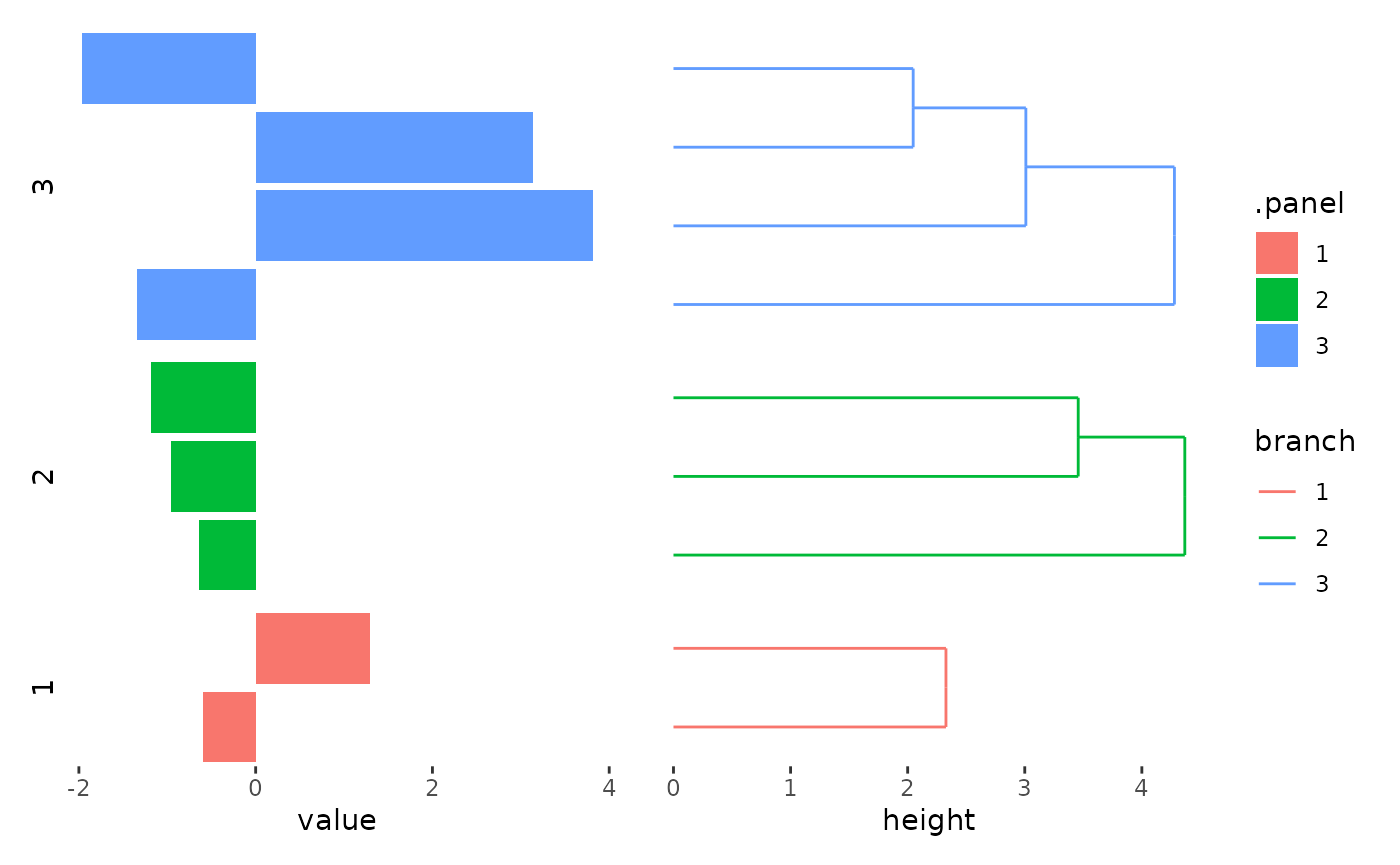
We can stack the plots vertically with
stack_alignv():
stack_alignv(small_mat) + align_dendro()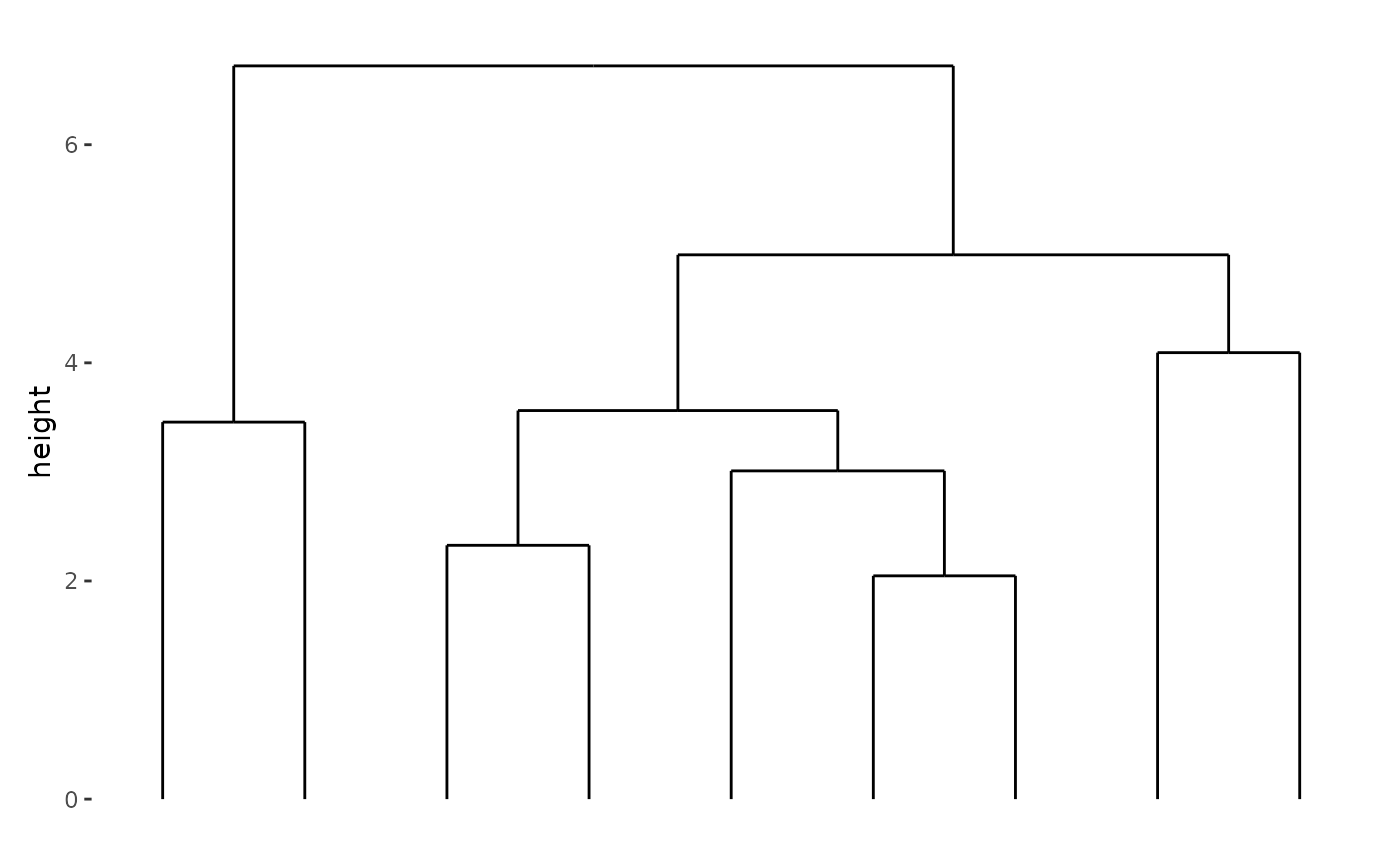
Note that vertical stack take the
x-axisas the observations, but horizontal stack take they-axisas the observations.
stack_align() can add plot without alignment of
observations.
stack_alignv() +
    ggfree(aes(displ, hwy, colour = class), data = mpg) +
    geom_point(size = 2) +
    ggfree(aes(displ, hwy, colour = class), data = mpg) +
    geom_point(size = 2) &
    scale_color_brewer(palette = "Dark2") &
    theme_bw()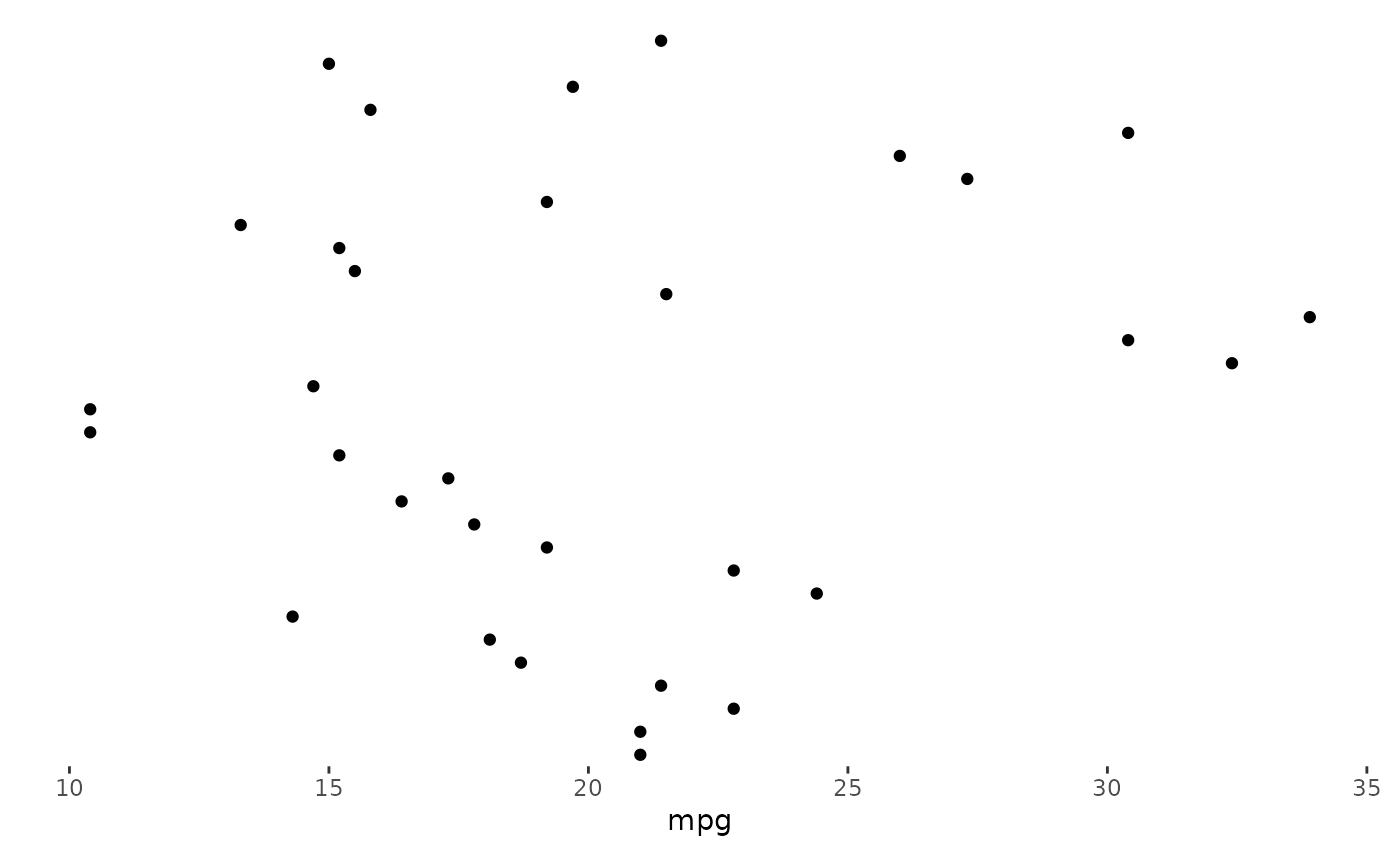
For stack_free(), only plots that are free from
alignment (ggfree()) can be added along the axis.
stack_free() alone is not very useful, since we can combine
multiple plots vertically or horizontally with
align_plots() or patchwork. The
only benefits would be the data can be inherited by multiple plots.
stack_freev(mpg) +
    ggfree(aes(displ, hwy, colour = class)) +
    geom_point(size = 2) +
    ggfree(aes(displ, hwy, colour = class)) +
    geom_point(size = 2) &
    scale_color_brewer(palette = "Dark2") &
    theme_bw()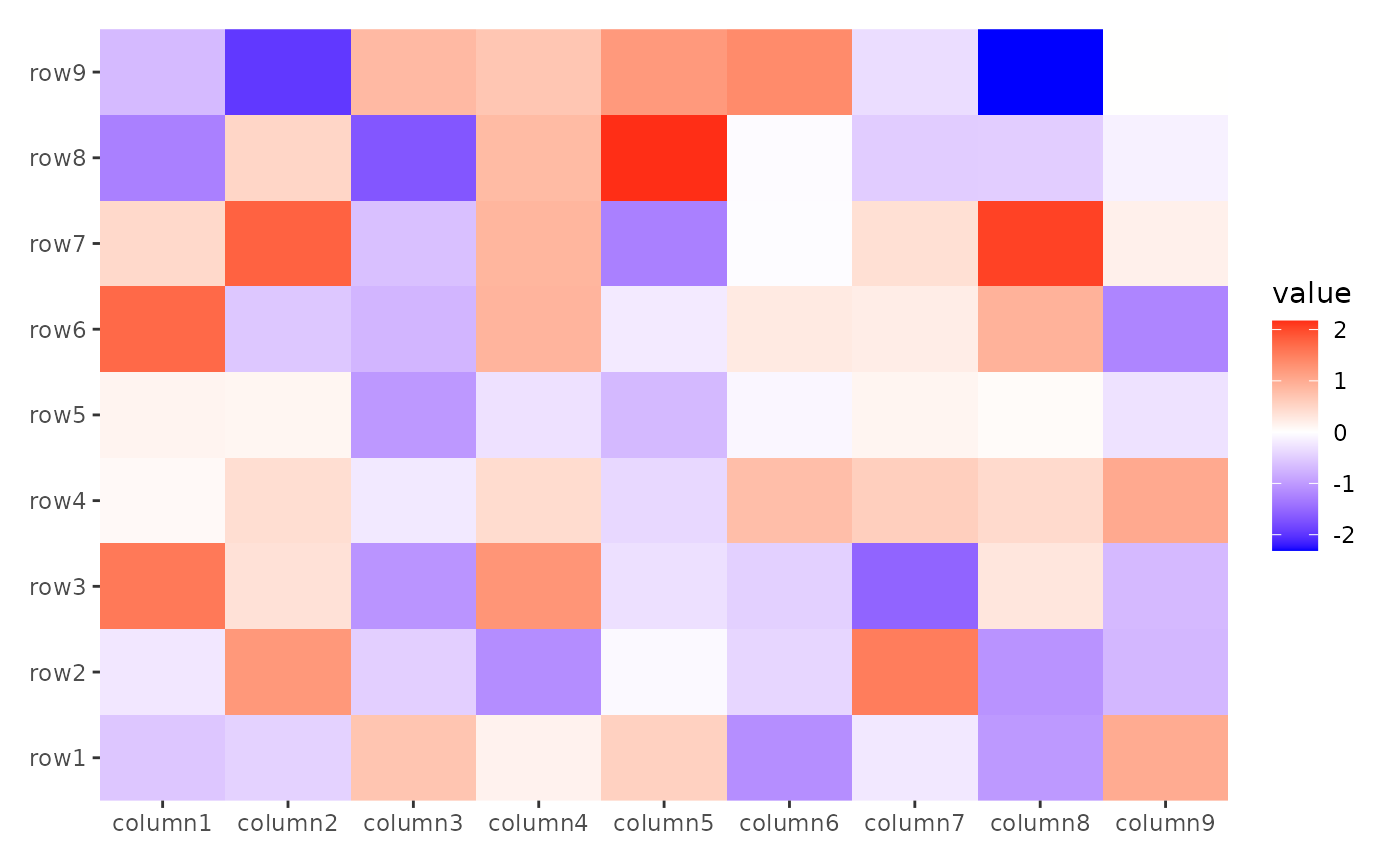
ggheatmap()/quad_layout()
ggheatmap()/quad_layout() can be added to a
stack layout.
stack_alignh(small_mat) +
    ggheatmap()
#> → heatmap built with `geom_tile()`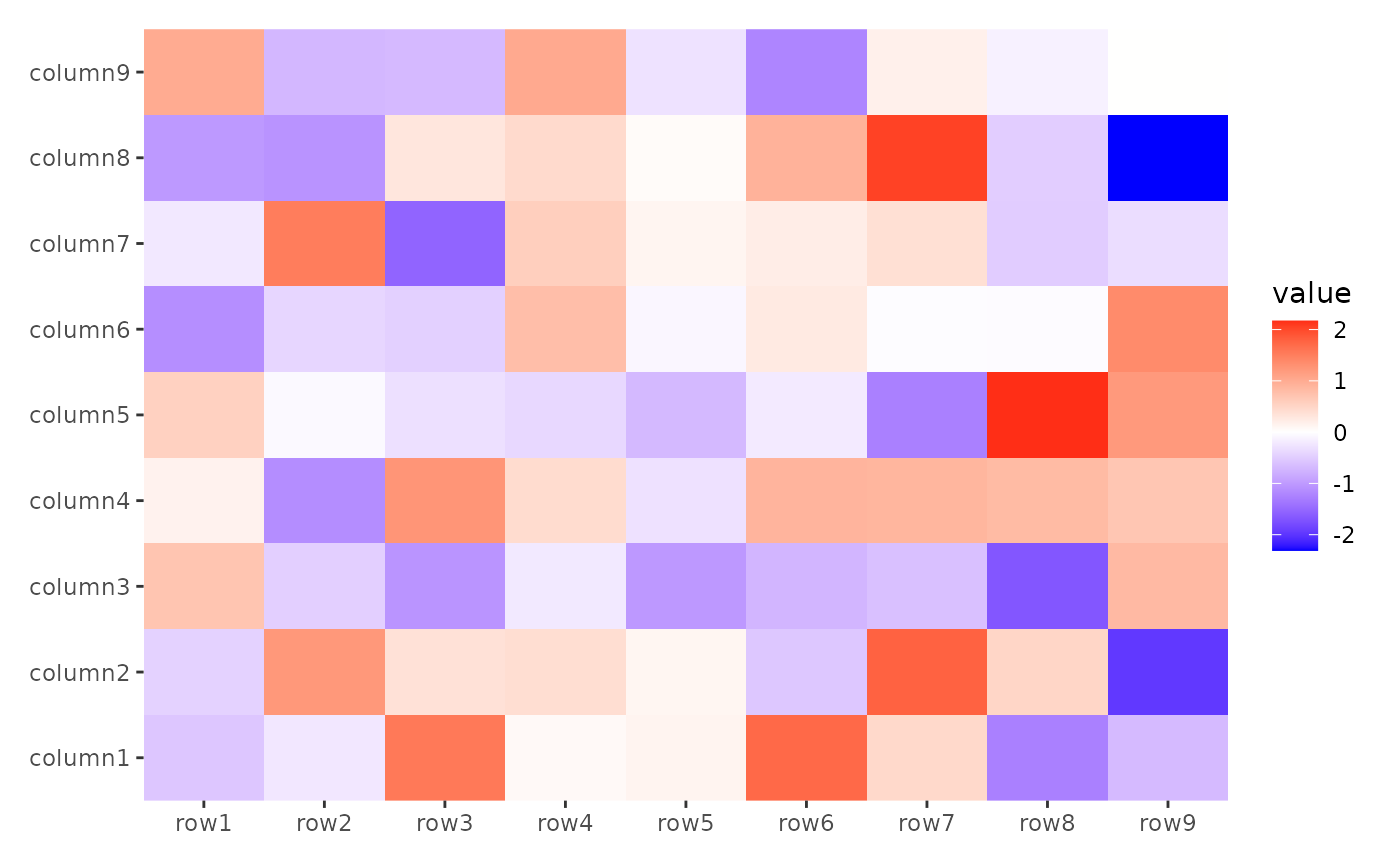
However, as noted earlier, stack_free() can only accept
plots that are free from alignment along the axis. Here’s a table
summarizing which layouts are compatible with
stack_free():
stack_freeh() |
stack_freev() |
|
|---|---|---|
quad_free()/ggside()
|
✅ | ✅ |
quad_alignh() |
❌ | ✅ |
quad_alignv() |
✅ | ❌ |
quad_alignb()/ggheatmap()
|
❌ | ❌ |
alignh_quad_plot <- quad_alignh(small_mat) +
    geom_boxplot(aes(value, .row_names, fill = .row_names)) +
    scale_fill_brewer(palette = "Dark2")
stack_freev() +
    alignh_quad_plot +
    alignh_quad_plot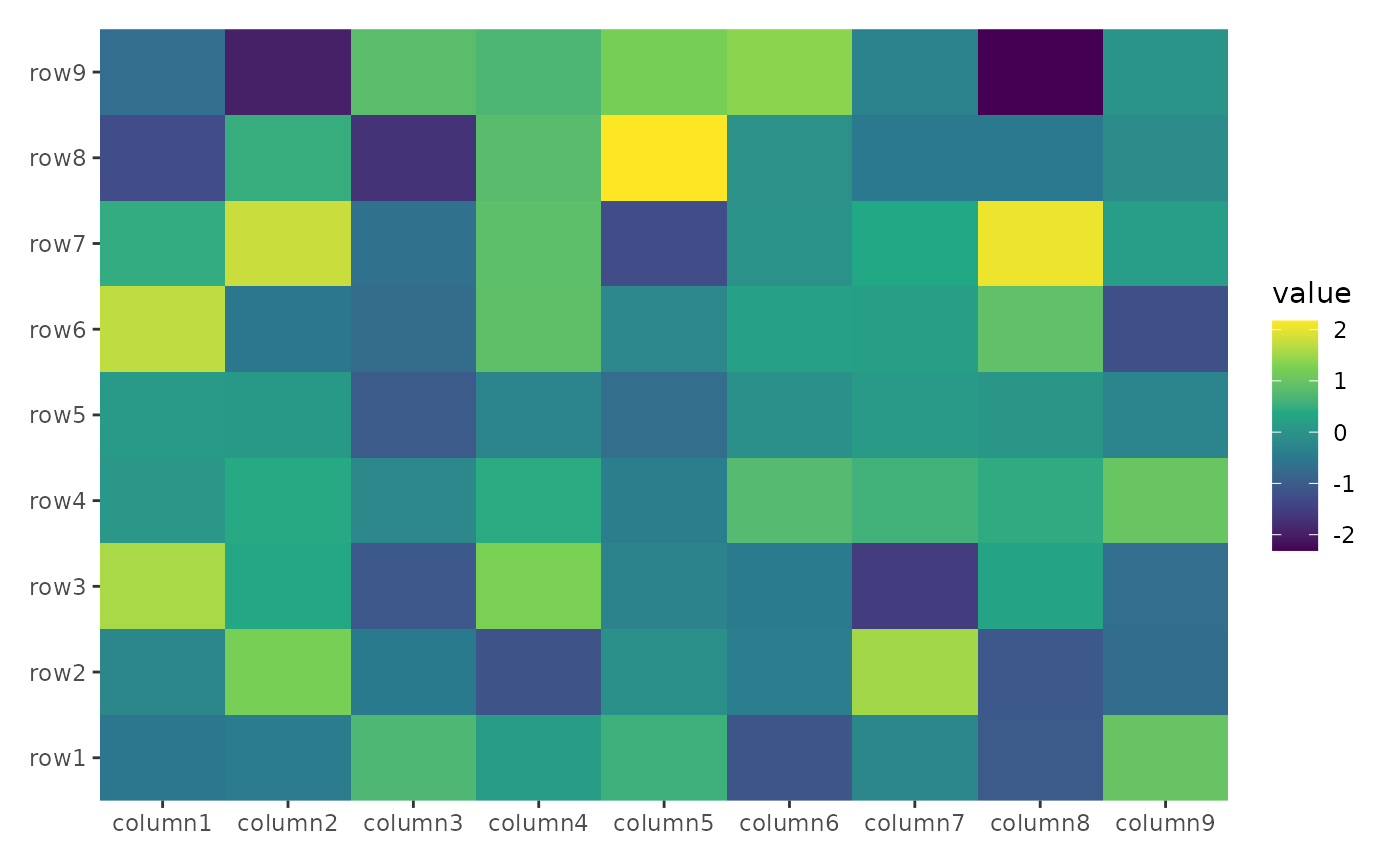
The data of ggheatmap()/quad_layout() can
inherit from the parent stack_layout(), but the data format must match.
Otherwise, you will need to manually provide the data. When
ggheatmap()/quad_layout() is added to a
vertical stack_align(), the inherited matrix is transposed before
use.
stack_alignv(small_mat) +
    ggheatmap()
#> → heatmap built with `geom_tile()`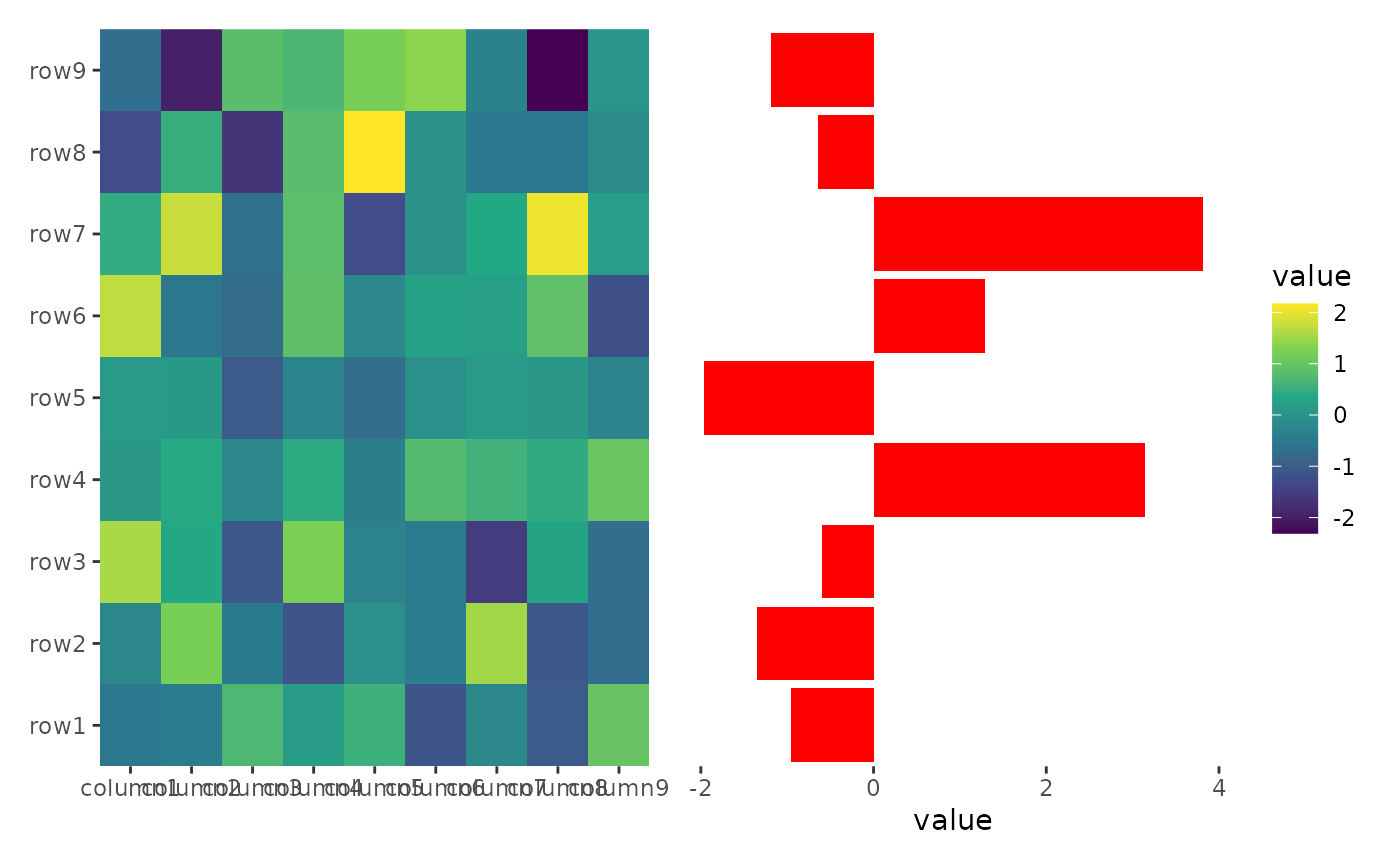
Once a ggheatmap()/quad_layout() is added,
any further elements you add will be applied to this
ggheatmap()/quad_layout(). You can include
align_* elements or any ggplot2 components for the
quad_layout().
stack_alignh(small_mat) +
    ggheatmap() +
    scale_fill_viridis_c()
#> → heatmap built with `geom_tile()`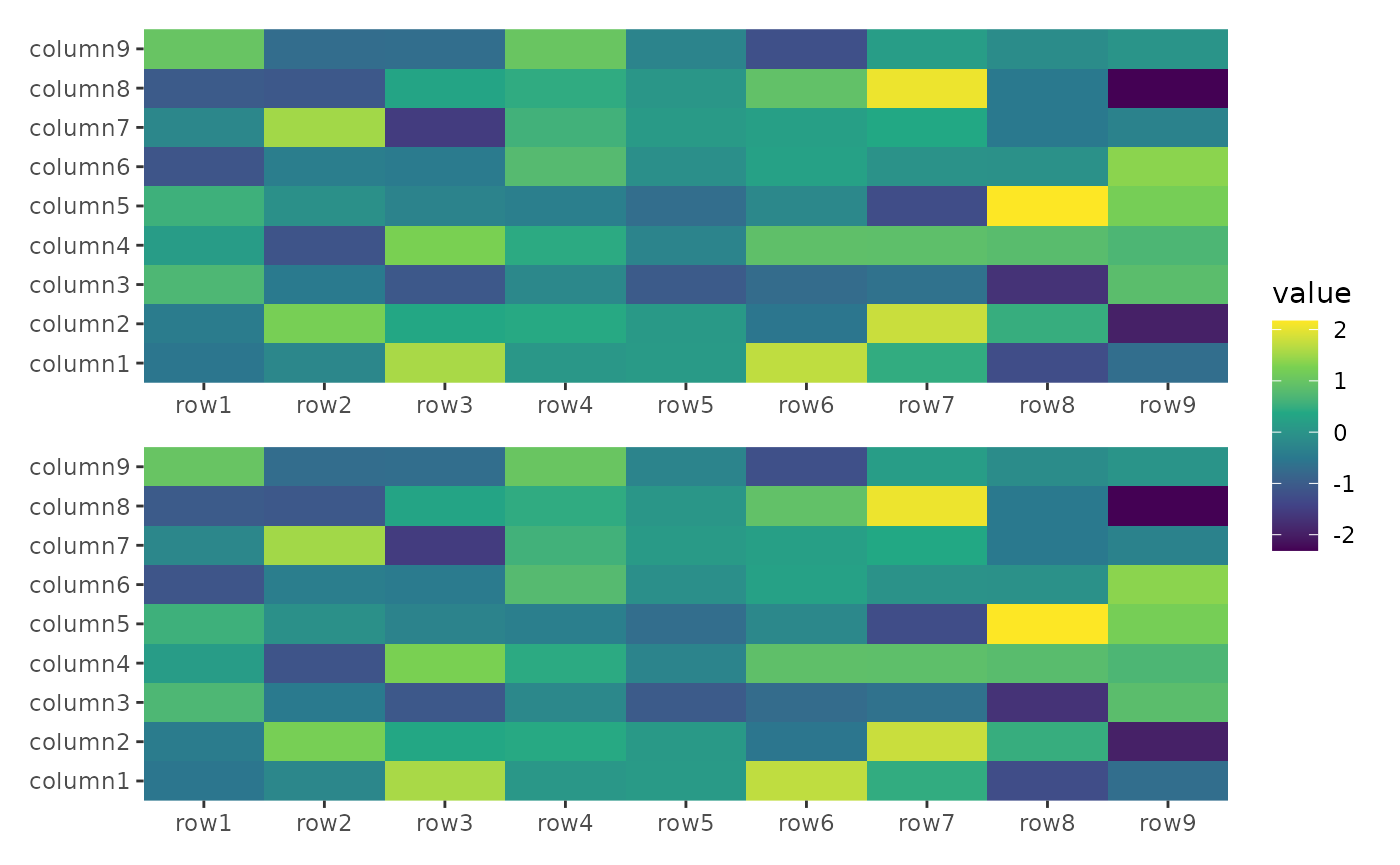
If you’d like to add elements to the stack layout rather than the
ggheatmap()/quad_layout() layout, you can
easily switch from the
ggheatmap()/quad_layout() to the stack layout
using stack_active().
stack_alignh(small_mat) +
    ggheatmap() +
    scale_fill_viridis_c() +
    theme(axis.text.x = element_text(angle = -60, hjust = 0)) +
    stack_active() +
    ggalign(data = rowSums) +
    geom_bar(aes(value), fill = "red", orientation = "y", stat = "identity")
#> → heatmap built with `geom_tile()`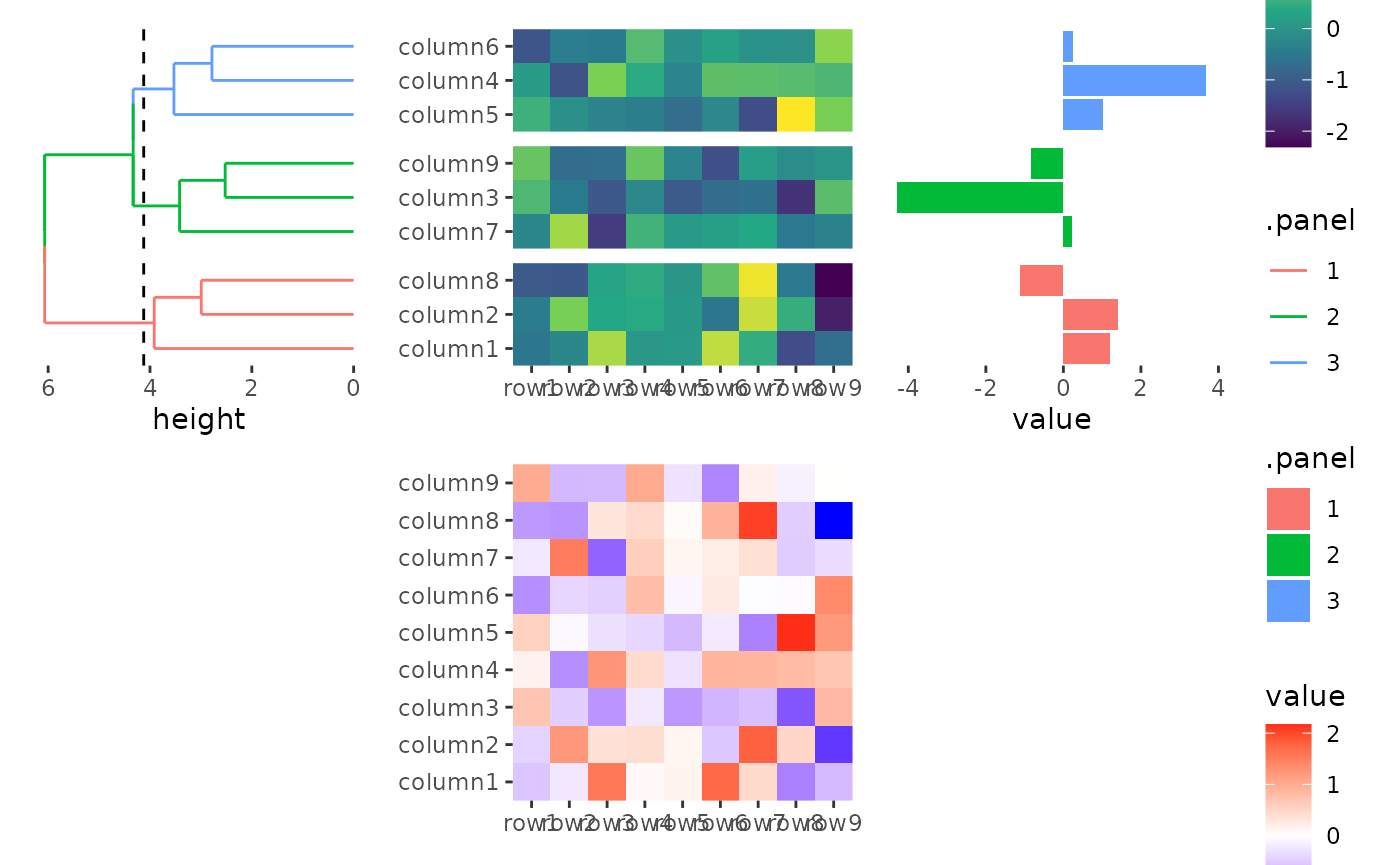
One exception is the
ggheatmap()/quad_layout() itself, which cannot
be added to another heatmap layout. Therefore, you can directly add a
ggheatmap()/quad_layout() to the stack layout
without using stack_active().
stack_alignv(small_mat) +
    ggheatmap() +
    ggheatmap() &
    scale_fill_viridis_c()
#> → heatmap built with `geom_tile()`
#> → heatmap built with `geom_tile()`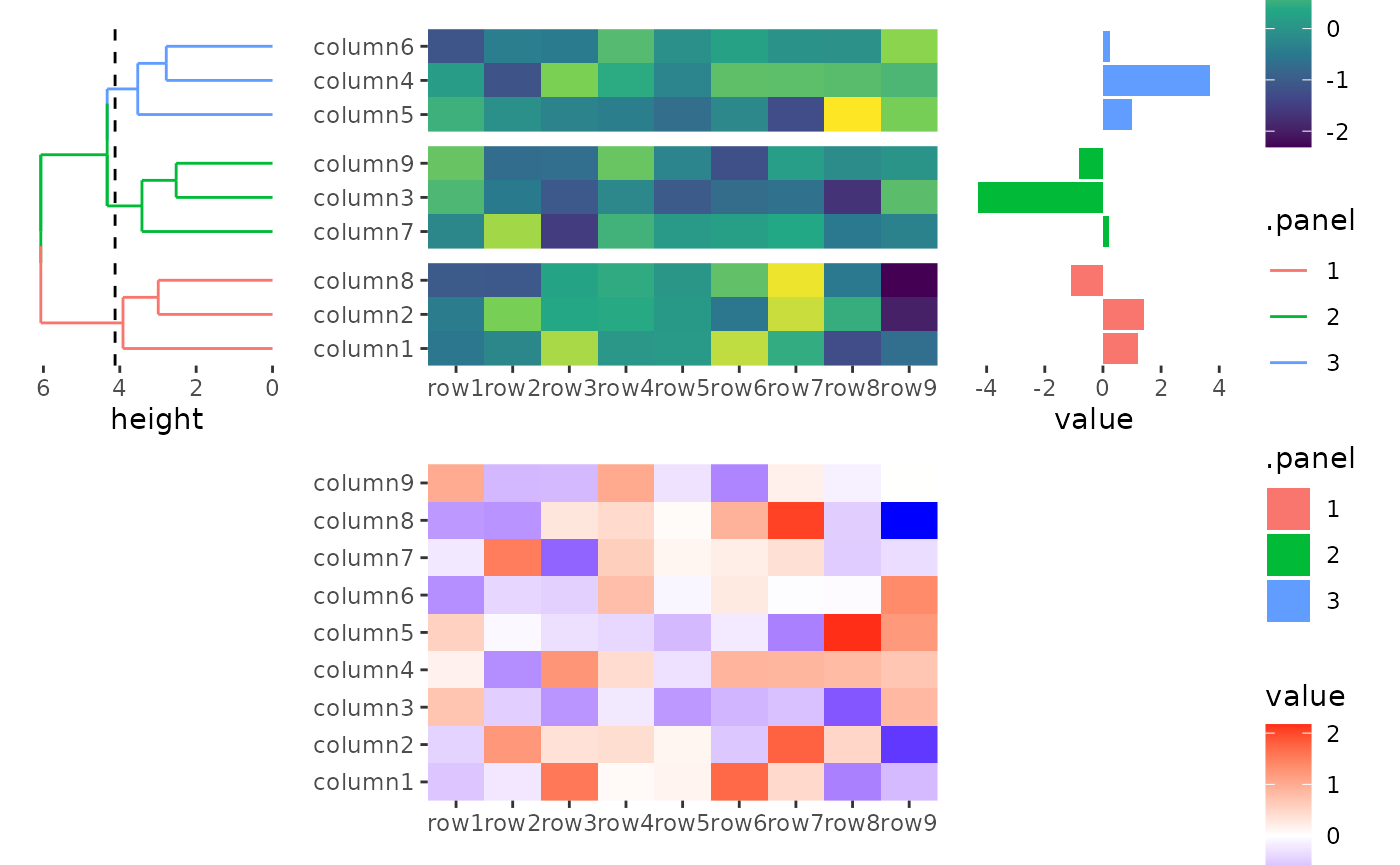
Control sizes
A length of 3 sizes should be provided in
stack_align()/stack_free() when putting a
heatmap with flank annotation into the stack layout. For vertical
stacks, this means heatmaps with left or right annotations; for
horizontal stacks, this means heatmaps with top or bottom annotations.
The first size controls the relative
width/height of the left or top annotation,
the second controls the relative size of the heatmap body
width/height, and the third controls the
relative width/height of the right or bottom
annotation.
By default the three rows/columns will have equal sizes.
stack_alignv(small_mat) +
    ggheatmap() +
    scale_fill_viridis_c() +
    theme(axis.text.x = element_text(angle = -60, hjust = 0)) +
    anno_left() +
    align_dendro(aes(color = .panel), k = 3L) +
    anno_right() +
    ggalign(data = rowSums) +
    geom_bar(aes(value, fill = .panel), orientation = "y", stat = "identity") +
    ggheatmap() +
    theme(axis.text.x = element_text(angle = -60, hjust = 0))
#> → heatmap built with `geom_tile()`
#> → heatmap built with `geom_tile()`
# the left annotation, will have a relative size 1
# the heatmap body will have a relative width 2
# the right annotation will have a relative size 1
stack_alignv(small_mat, sizes = c(1, 2, 1)) +
    ggheatmap() +
    scale_fill_viridis_c() +
    theme(axis.text.x = element_text(angle = -60, hjust = 0)) +
    anno_left() +
    align_dendro(aes(color = .panel), k = 3L) +
    anno_right() +
    ggalign(data = rowSums) +
    geom_bar(aes(value, fill = .panel), orientation = "y", stat = "identity") +
    ggheatmap() +
    theme(axis.text.x = element_text(angle = -60, hjust = 0))
#> → heatmap built with `geom_tile()`
#> → heatmap built with `geom_tile()`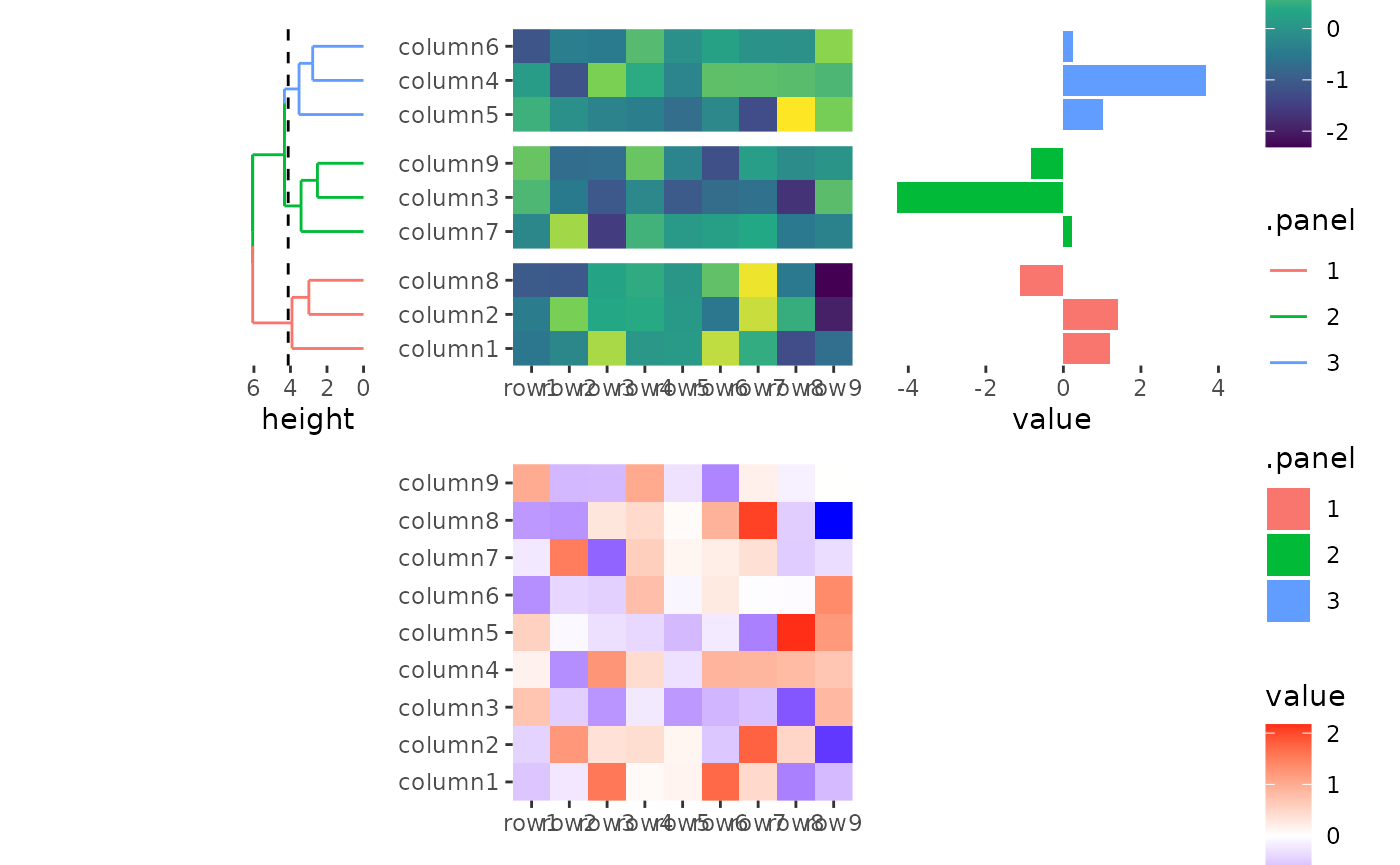
In this way, heatmap body width/height specified in
quad_active() or ggheatmap() won’t work.
stack_alignv(small_mat) +
    ggheatmap(width = unit(2, "null")) + # not work
    scale_fill_viridis_c() +
    theme(axis.text.x = element_text(angle = -60, hjust = 0)) +
    anno_left() +
    align_dendro(aes(color = .panel), k = 3L) +
    anno_right() +
    ggalign(data = rowSums) +
    geom_bar(aes(value, fill = .panel), orientation = "y", stat = "identity") +
    ggheatmap(width = unit(2, "null")) + # not work
    theme(axis.text.x = element_text(angle = -60, hjust = 0))
#> → heatmap built with `geom_tile()`
#> → heatmap built with `geom_tile()`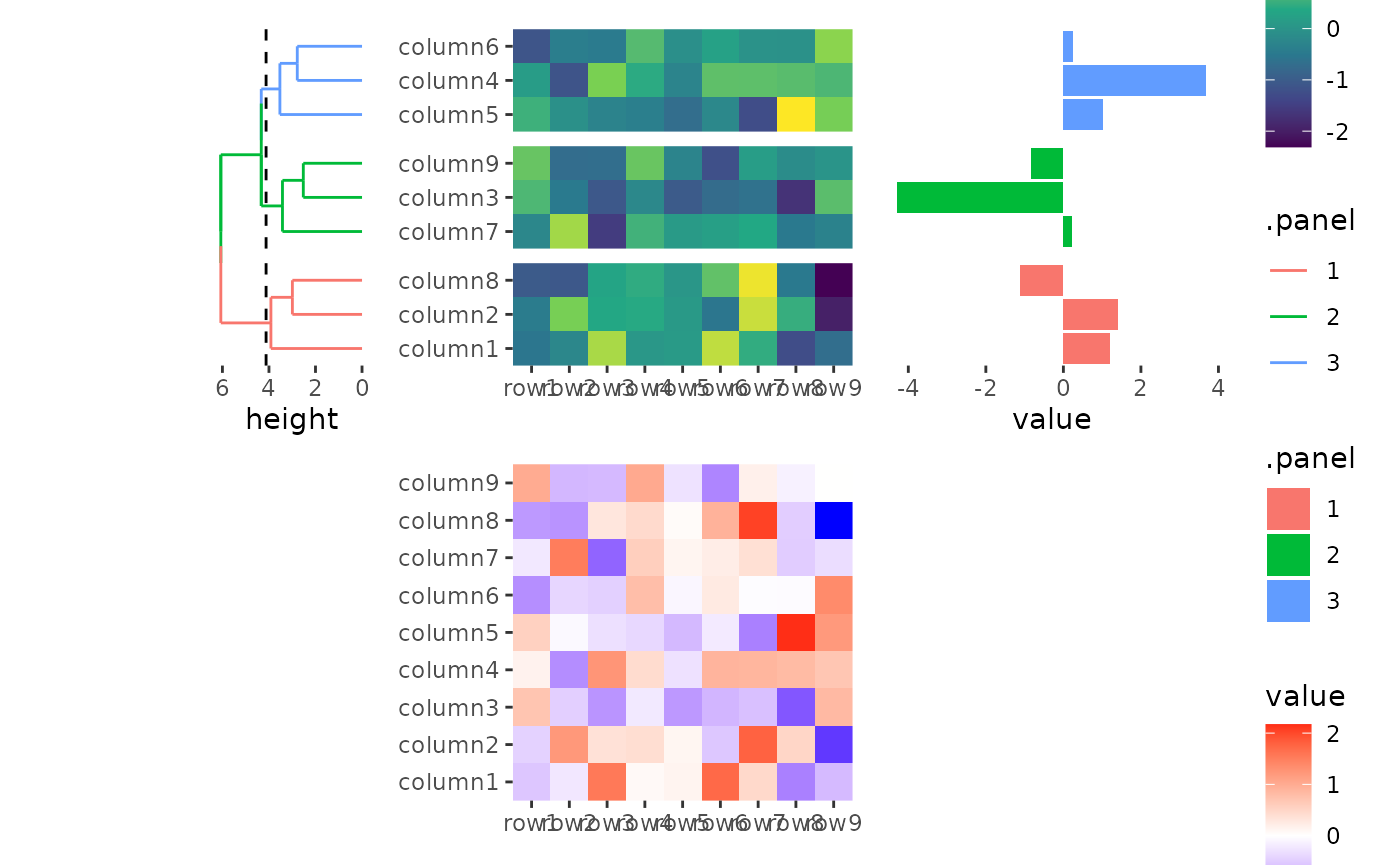
By default the flank annotation will fill the whole stack flank, but
we can still control the size of heatmap annotation in
quad_anno().
stack_alignv(small_mat) +
    ggheatmap() +
    scale_fill_viridis_c() +
    theme(axis.text.x = element_text(angle = -60, hjust = 0)) +
    # the left annotation will have a total size 2cm
    anno_left(size = unit(2, "cm")) +
    align_dendro(aes(color = .panel), k = 3L) +
    anno_right() +
    ggalign(data = rowSums) +
    geom_bar(aes(value, fill = .panel), orientation = "y", stat = "identity") +
    ggheatmap() +
    theme(axis.text.x = element_text(angle = -60, hjust = 0))
#> → heatmap built with `geom_tile()`
#> → heatmap built with `geom_tile()`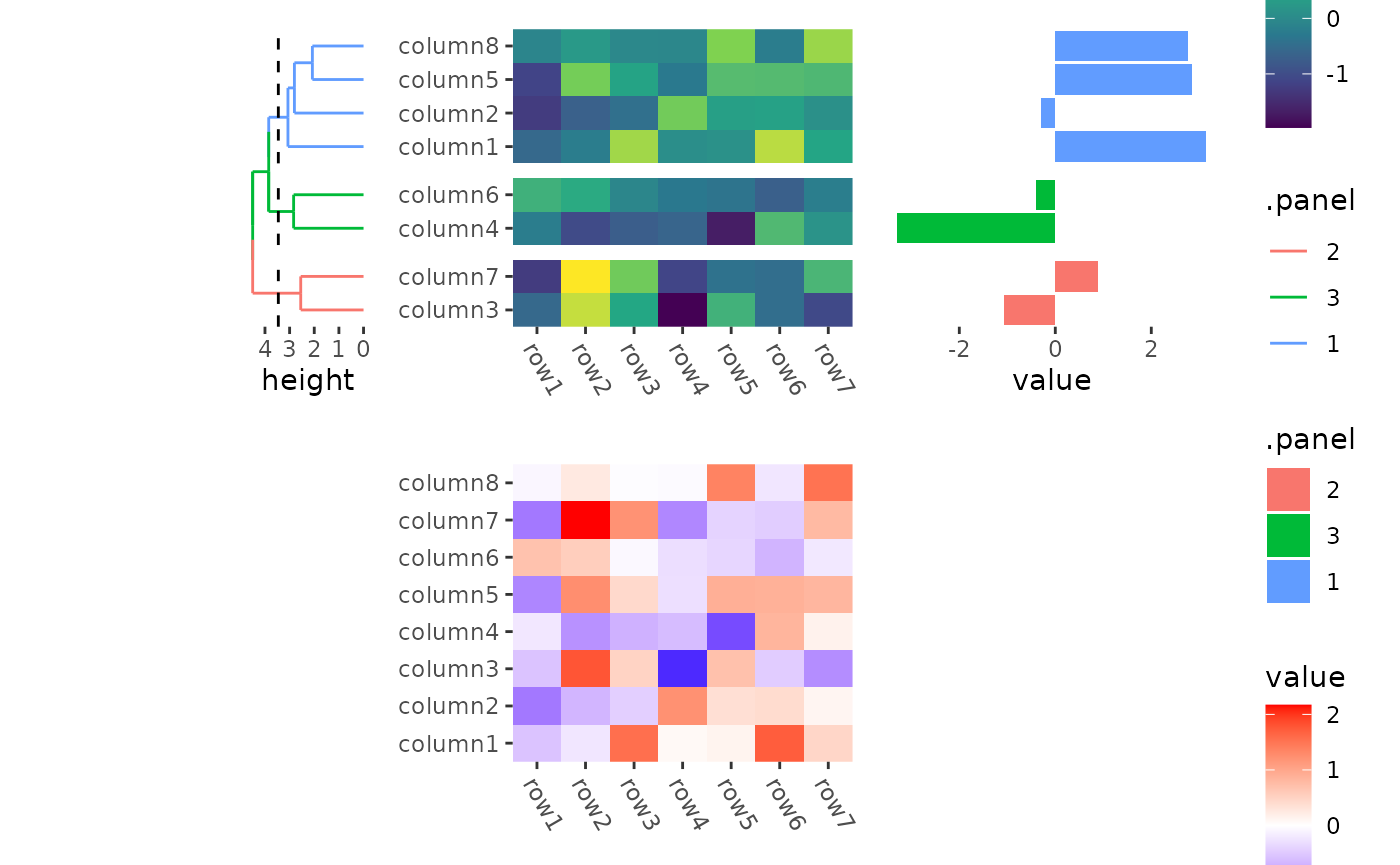
You can also use npc unit.
stack_alignv(small_mat) +
    ggheatmap() +
    scale_fill_viridis_c() +
    theme(axis.text.x = element_text(angle = -60, hjust = 0)) +
    # the left annotation will have a total width 1/2 npc
    anno_left(size = unit(0.5, "npc")) +
    align_dendro(aes(color = .panel), k = 3L) +
    anno_right() +
    ggalign(data = rowSums) +
    geom_bar(aes(value, fill = .panel), orientation = "y", stat = "identity") +
    ggheatmap() +
    theme(axis.text.x = element_text(angle = -60, hjust = 0))
#> → heatmap built with `geom_tile()`
#> → heatmap built with `geom_tile()`
Session information
sessionInfo()
#> R version 4.4.2 (2024-10-31)
#> Platform: x86_64-pc-linux-gnu
#> Running under: Ubuntu 22.04.5 LTS
#>
#> Matrix products: default
#> BLAS:   /usr/lib/x86_64-linux-gnu/openblas-pthread/libblas.so.3
#> LAPACK: /usr/lib/x86_64-linux-gnu/openblas-pthread/libopenblasp-r0.3.20.so;  LAPACK version 3.10.0
#>
#> locale:
#>  [1] LC_CTYPE=C.UTF-8       LC_NUMERIC=C           LC_TIME=C.UTF-8
#>  [4] LC_COLLATE=C.UTF-8     LC_MONETARY=C.UTF-8    LC_MESSAGES=C.UTF-8
#>  [7] LC_PAPER=C.UTF-8       LC_NAME=C              LC_ADDRESS=C
#> [10] LC_TELEPHONE=C         LC_MEASUREMENT=C.UTF-8 LC_IDENTIFICATION=C
#>
#> time zone: UTC
#> tzcode source: system (glibc)
#>
#> attached base packages:
#> [1] stats     graphics  grDevices utils     datasets  methods   base
#>
#> other attached packages:
#> [1] ggalign_0.0.5 ggplot2_3.5.1
#>
#> loaded via a namespace (and not attached):
#>  [1] gtable_0.3.6       jsonlite_1.8.9     dplyr_1.1.4        compiler_4.4.2
#>  [5] tidyselect_1.2.1   jquerylib_0.1.4    systemfonts_1.1.0  scales_1.3.0
#>  [9] textshaping_0.4.0  yaml_2.3.10        fastmap_1.2.0      R6_2.5.1
#> [13] labeling_0.4.3     generics_0.1.3     knitr_1.49         tibble_3.2.1
#> [17] desc_1.4.3         munsell_0.5.1      bslib_0.8.0        pillar_1.9.0
#> [21] RColorBrewer_1.1-3 rlang_1.1.4        utf8_1.2.4         cachem_1.1.0
#> [25] xfun_0.49          fs_1.6.5           sass_0.4.9         viridisLite_0.4.2
#> [29] cli_3.6.3          pkgdown_2.1.1      withr_3.0.2        magrittr_2.0.3
#> [33] digest_0.6.37      grid_4.4.2         lifecycle_1.0.4    vctrs_0.6.5
#> [37] evaluate_1.0.1     glue_1.8.0         farver_2.1.2       ragg_1.3.3
#> [41] fansi_1.0.6        colorspace_2.1-1   rmarkdown_2.29     tools_4.4.2
#> [45] pkgconfig_2.0.3    htmltools_0.5.8.1