Let’s prepare some example data.
set.seed(123)
small_mat <- matrix(rnorm(72), nrow = 9)
rownames(small_mat) <- paste0("row", seq_len(nrow(small_mat)))
colnames(small_mat) <- paste0("column", seq_len(ncol(small_mat)))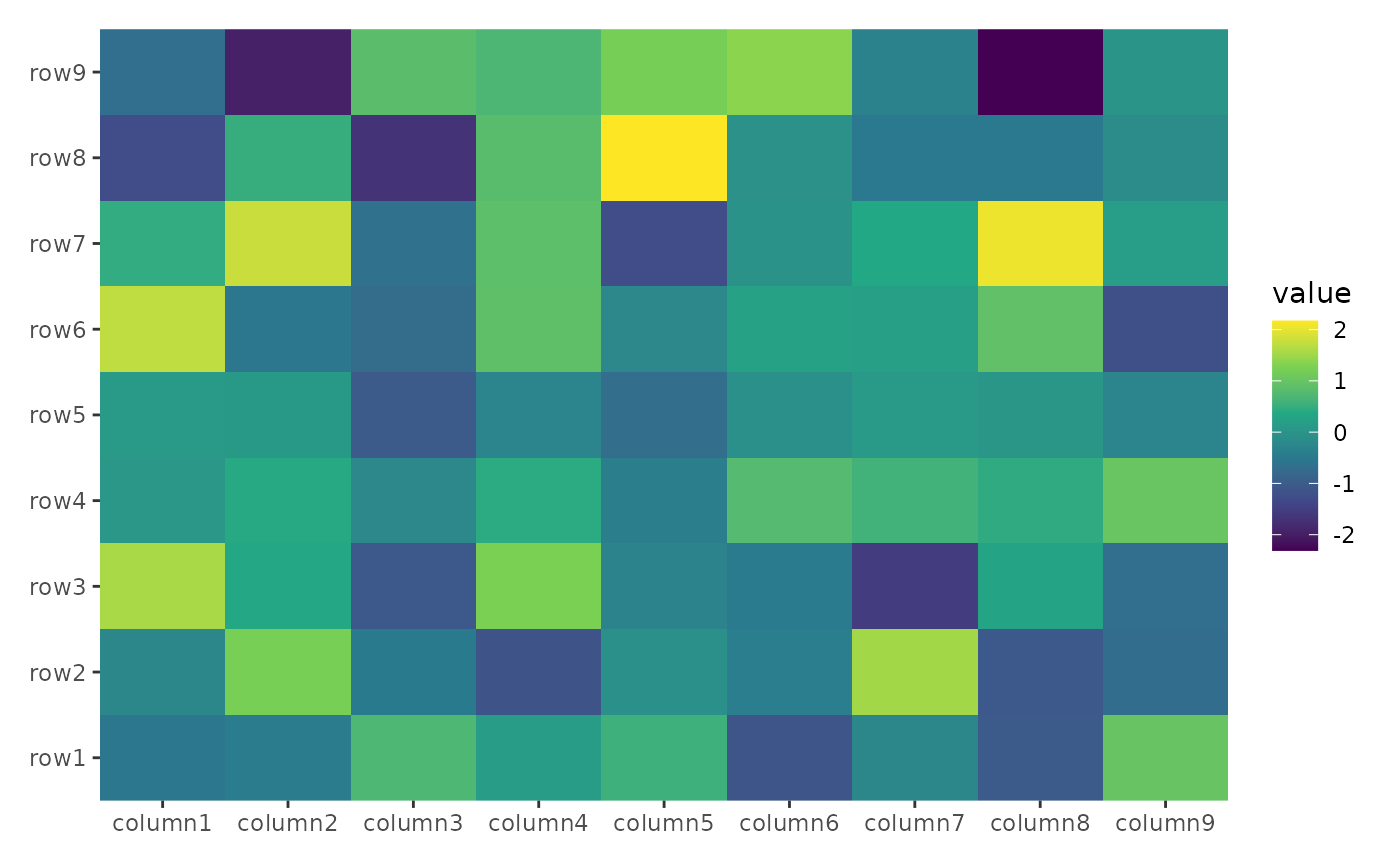
heatmap layout customize
Based on dendrogram
ggheatmap(small_mat) +
    scale_fill_viridis_c() +
    anno_top() +
    align_dendro(aes(color = branch), k = 3) +
    geom_point(aes(color = branch, y = y)) +
    scale_color_brewer(palette = "Dark2")
#> → heatmap built with `geom_tile()`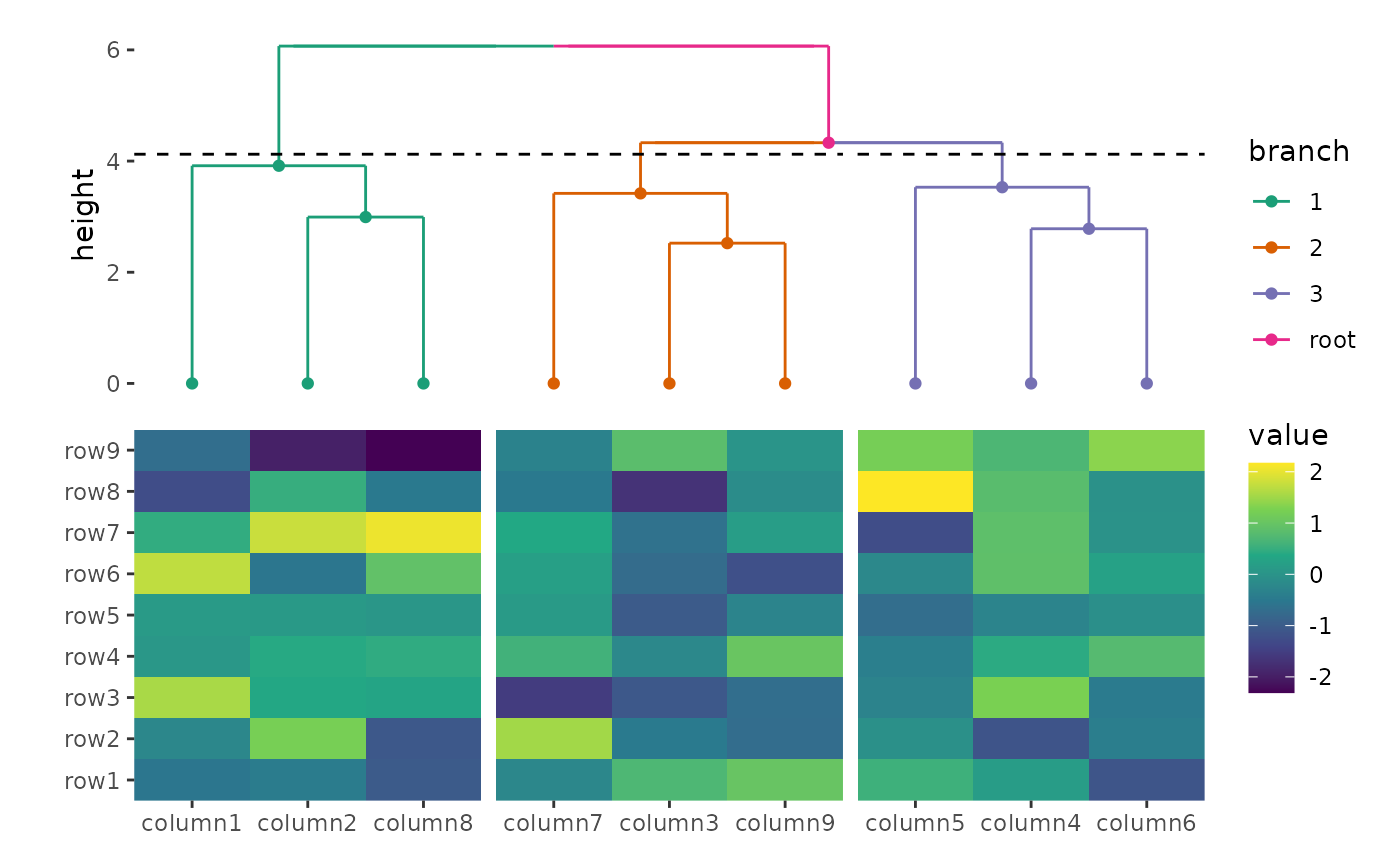
Based on kmeans
ggheatmap(small_mat) +
    scale_fill_viridis_c() +
    anno_top() +
    align_kmeans(3L)
#> → heatmap built with `geom_tile()`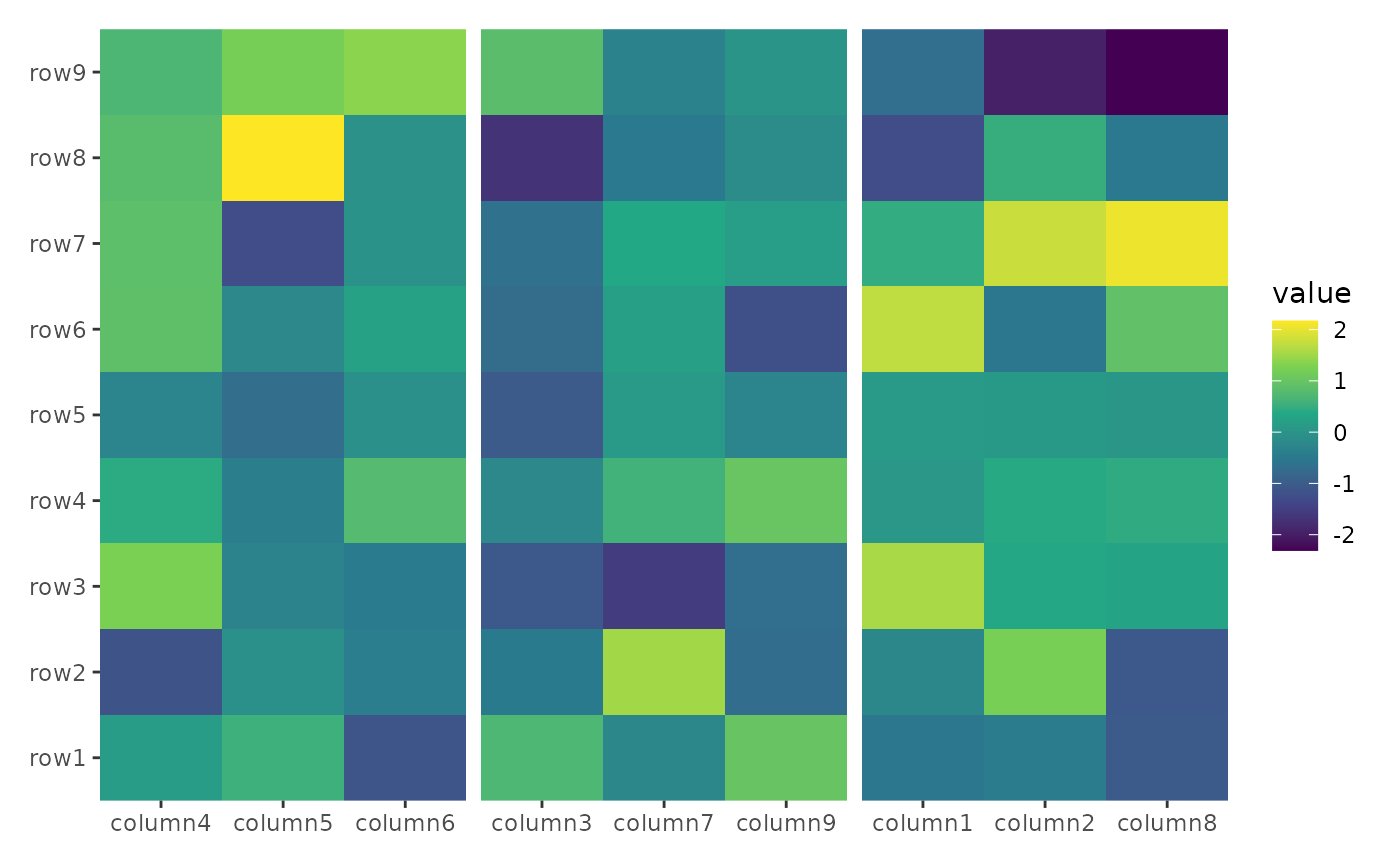
Based on a group variable
ggheatmap(small_mat) +
    scale_fill_viridis_c() +
    anno_top() +
    align_group(sample(letters[1:4], ncol(small_mat), replace = TRUE))
#> → heatmap built with `geom_tile()`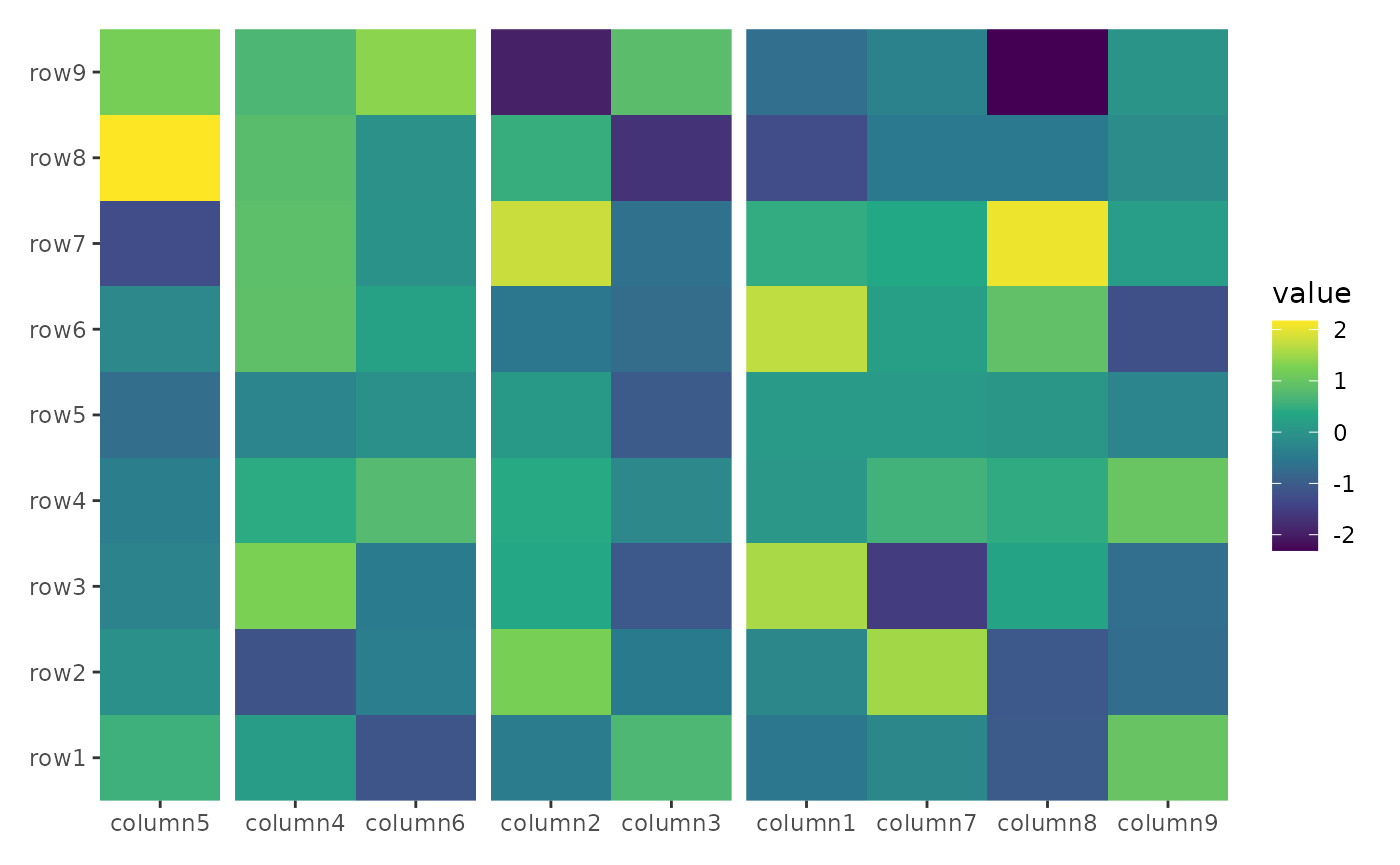
Based on an ordering weights
Here, we ordered the heatmap rows based on the row means.
ggheatmap(small_mat) +
    scale_fill_viridis_c() +
    anno_left() +
    align_order(rowMeans)
#> → heatmap built with `geom_tile()`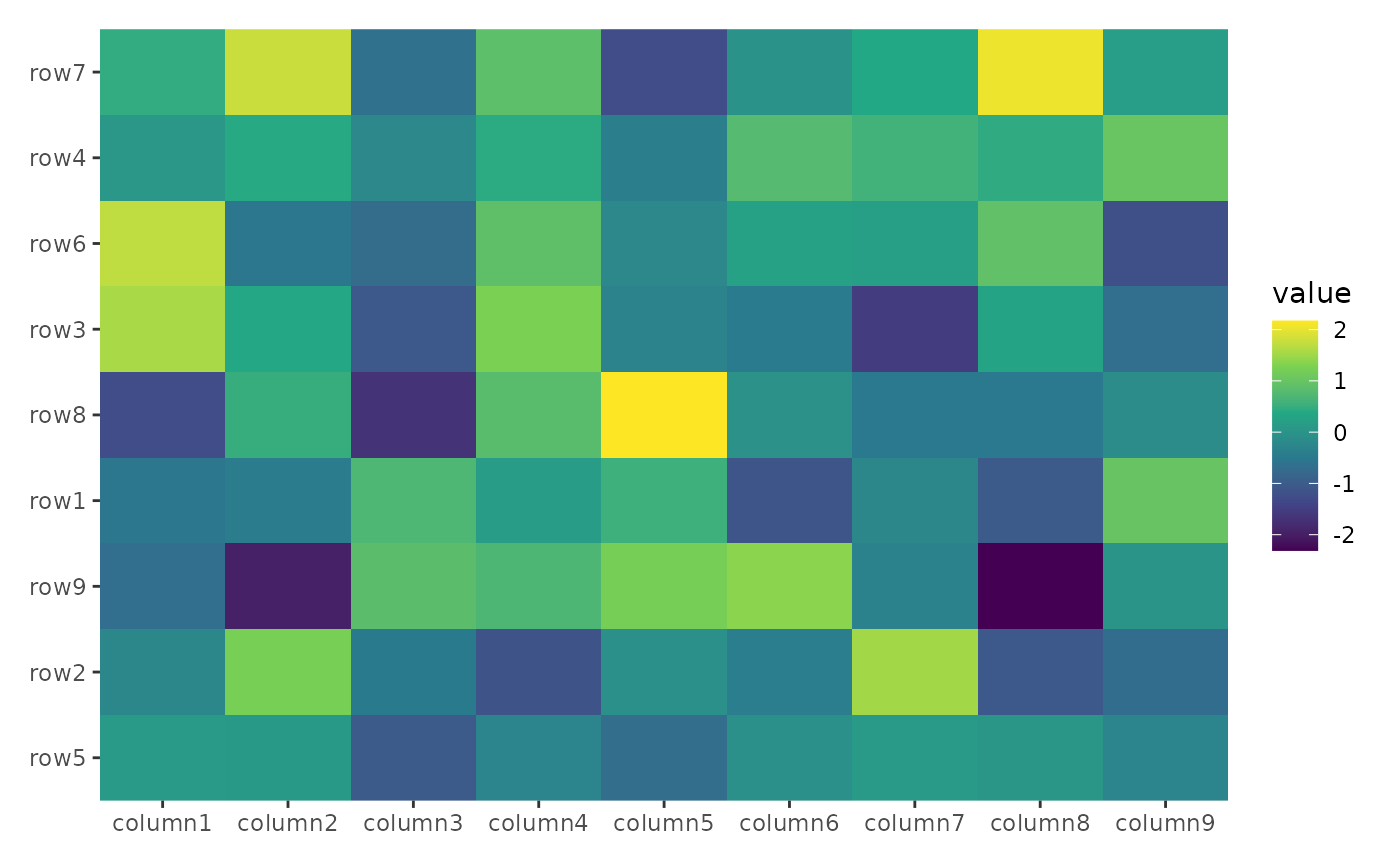
Heatmap annotation plot
ggheatmap(small_mat) +
    scale_fill_viridis_c() +
    anno_top() +
    align_dendro(aes(color = branch), k = 3) +
    geom_point(aes(color = branch, y = y)) +
    scale_color_brewer(palette = "Dark2") +
    ggalign(aes(y = value)) +
    geom_boxplot(aes(factor(.x), fill = .panel)) +
    scale_fill_brewer(palette = "Dark2")
#> → heatmap built with `geom_tile()`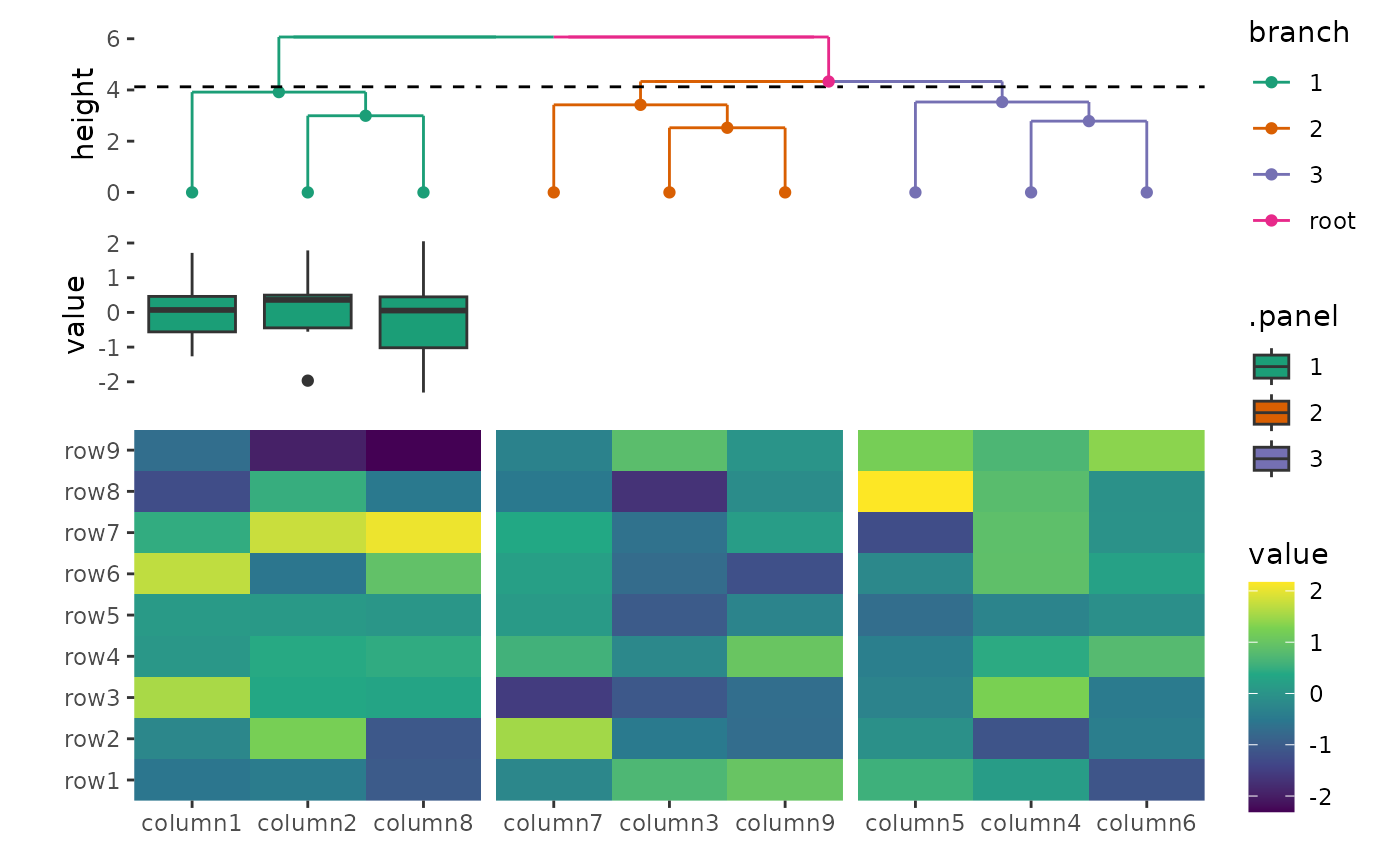
ggheatmap(small_mat) +
    scale_fill_viridis_c() +
    anno_top(size = 0.5) +
    align_dendro(aes(color = branch), k = 3L) +
    ggalign(aes(y = value), data = rowSums) +
    geom_bar(stat = "identity", aes(fill = factor(.panel))) +
    scale_fill_brewer(name = NULL, palette = "Dark2") +
    anno_left(size = 0.5) +
    align_dendro(aes(color = branch), size = 0.5, k = 4L) +
    ggalign(aes(x = value), data = rowSums) +
    geom_bar(
        aes(y = .y, fill = factor(.y)),
        stat = "identity",
        orientation = "y"
    ) +
    scale_fill_brewer(name = NULL, palette = "Paired", guide = "none")
#> → heatmap built with `geom_tile()`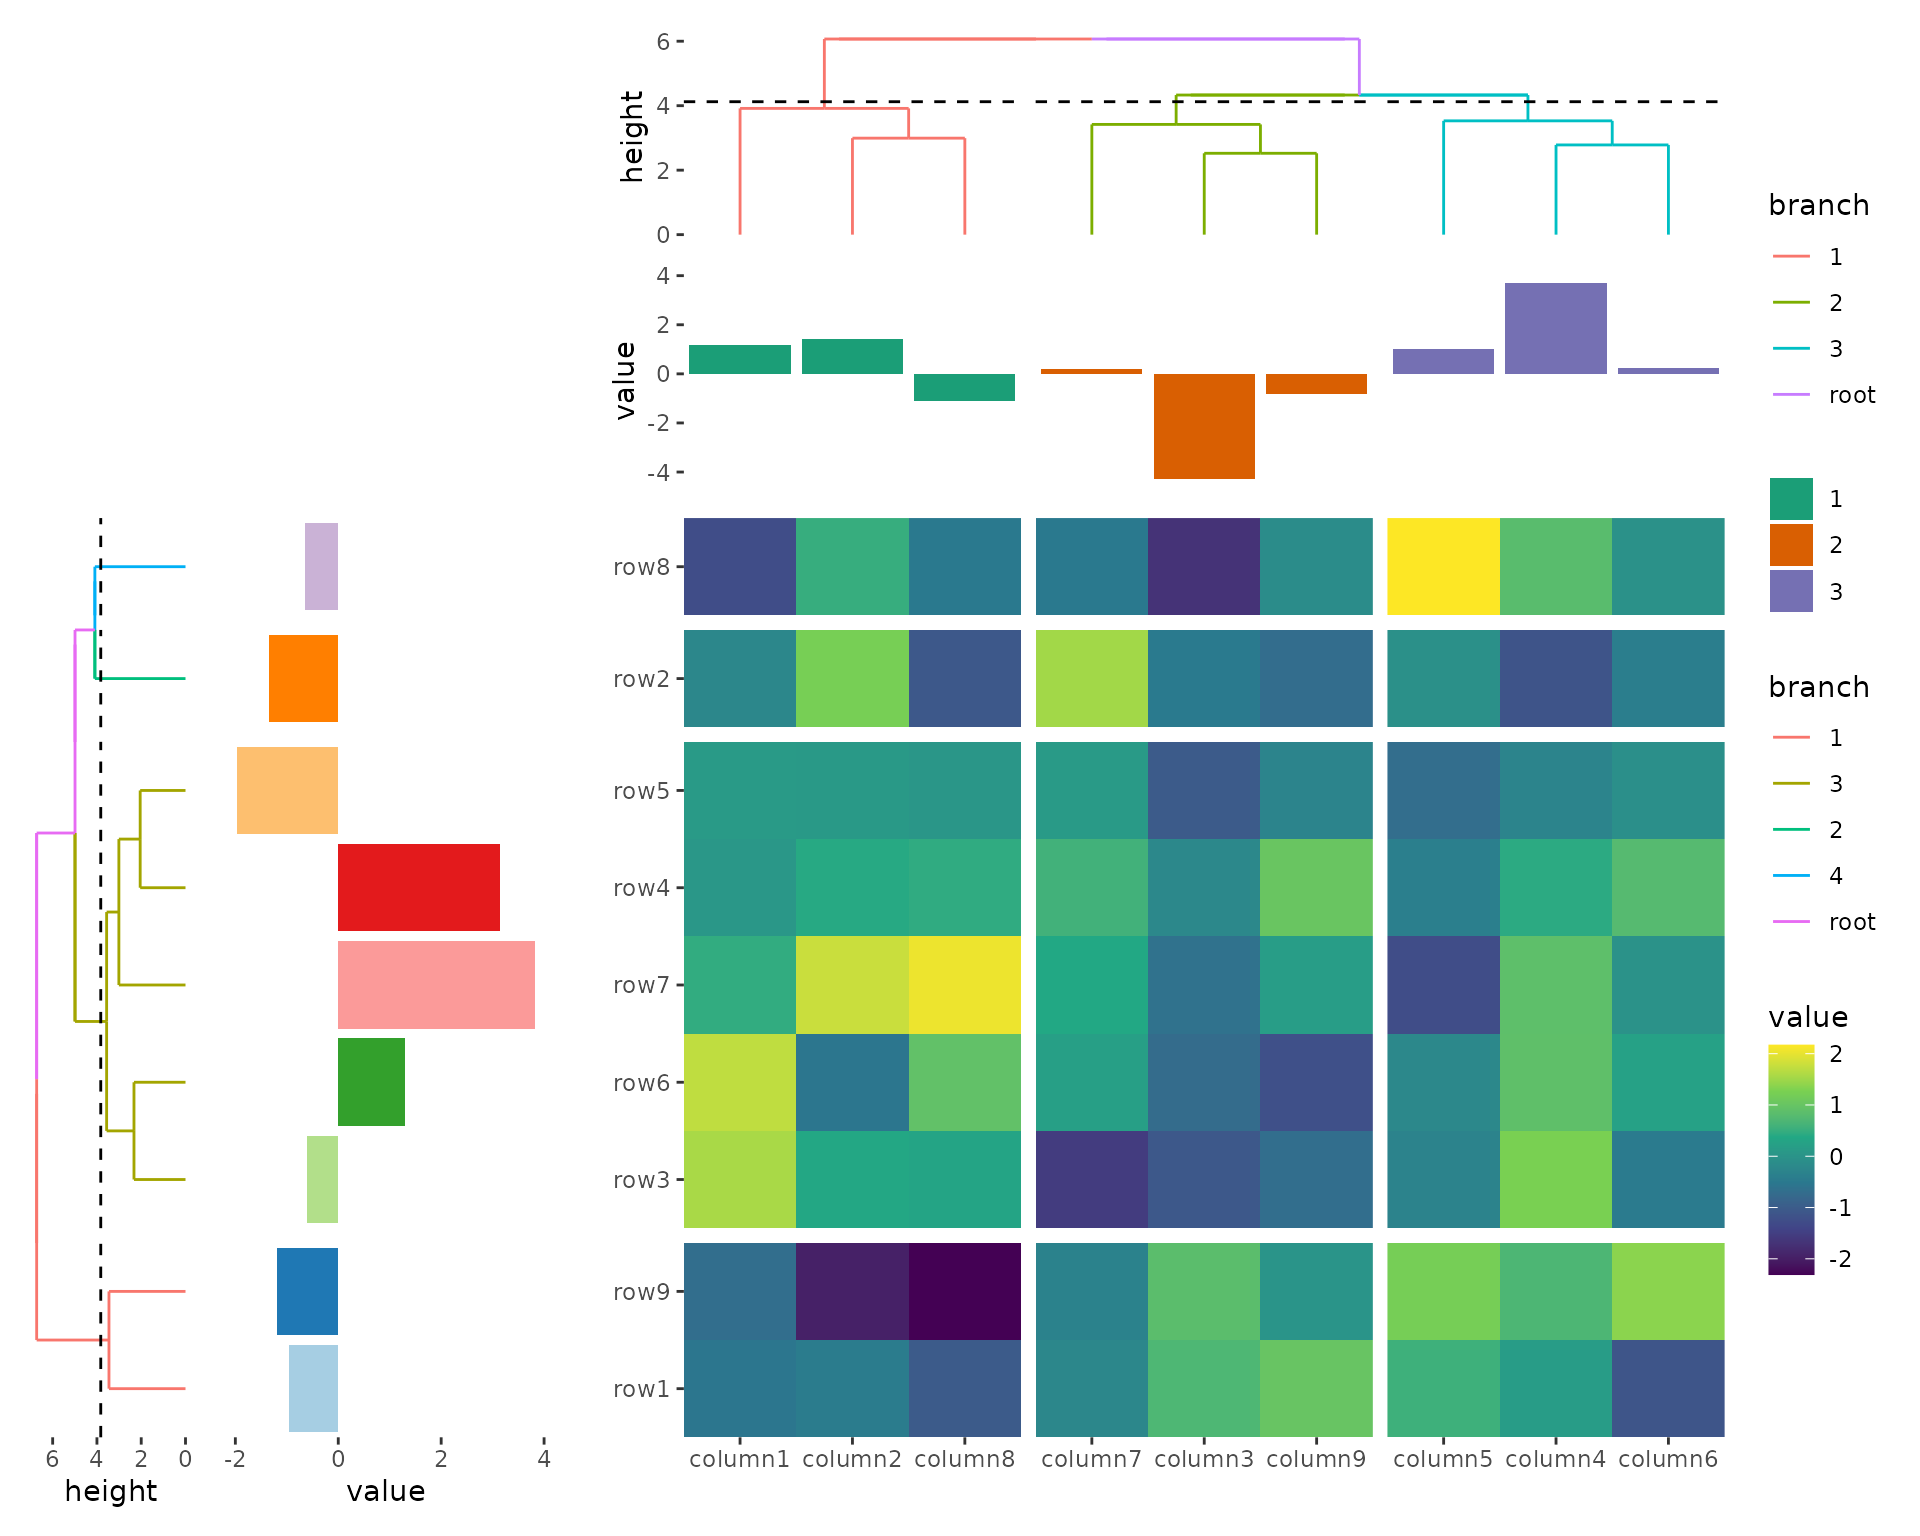
Multiple heatmaps
Horizontal layout
(stack_alignh(small_mat) +
    ggheatmap() +
    ggheatmap() &
    scale_fill_viridis_c() &
    theme(axis.text.x = element_text(angle = -60, hjust = 0))) +
    stack_active() +
    align_dendro(aes(color = branch), k = 4L, size = 0.2) +
    scale_color_brewer(palette = "Dark2")
#> → heatmap built with `geom_tile()`
#> → heatmap built with `geom_tile()`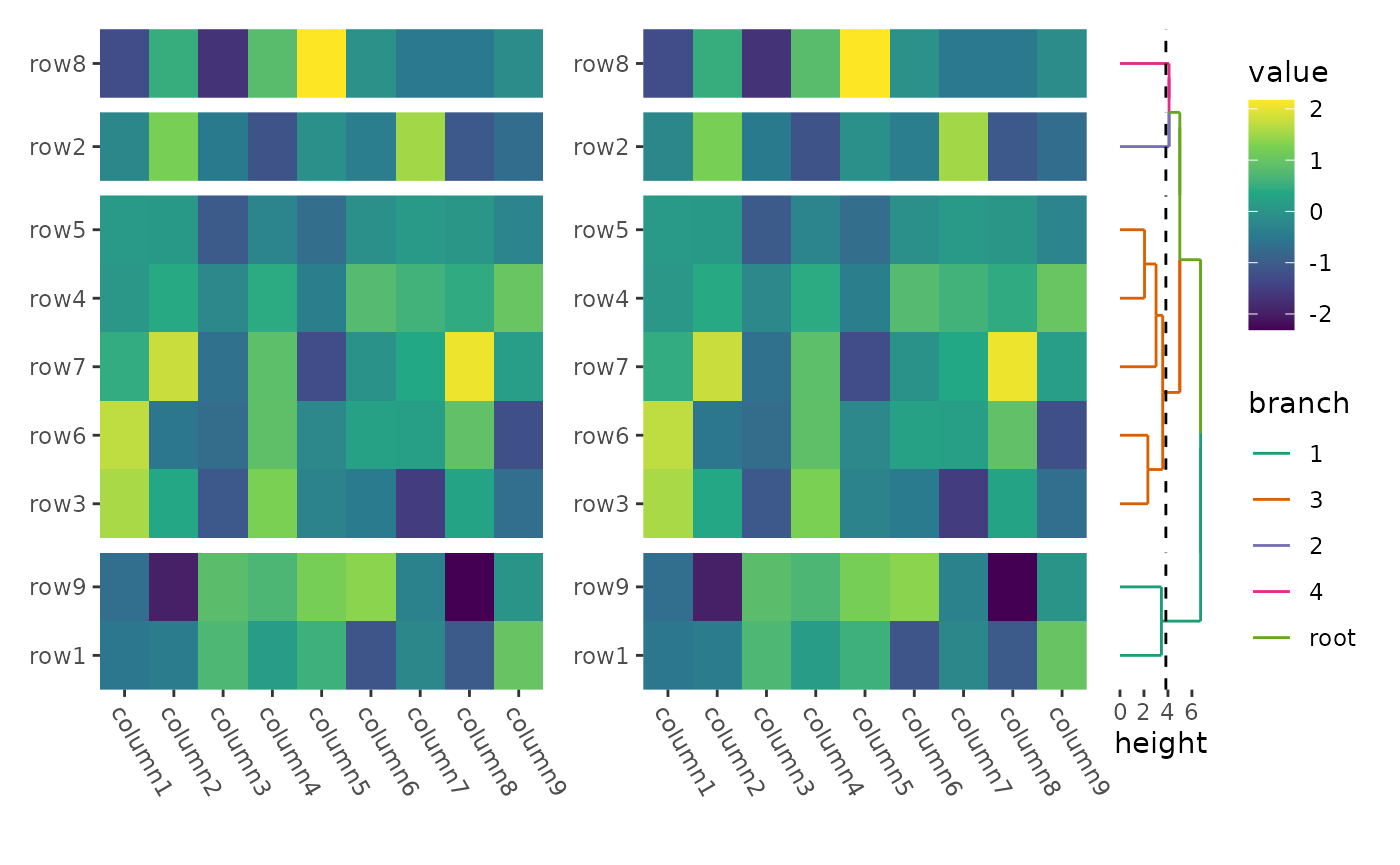
Vertical layout
stack_alignv(small_mat) -
    plot_theme(
        axis.text.x = element_blank(),
        axis.ticks.x = element_blank()
    ) +
    align_dendro(aes(color = branch), k = 4L, size = 0.2) +
    scale_color_brewer(palette = "Dark2") +
    ggheatmap() +
    ggheatmap() +
    theme(axis.text.x = element_text(angle = -60, hjust = 0)) &
    scale_fill_viridis_c()
#> → heatmap built with `geom_tile()`
#> → heatmap built with `geom_tile()`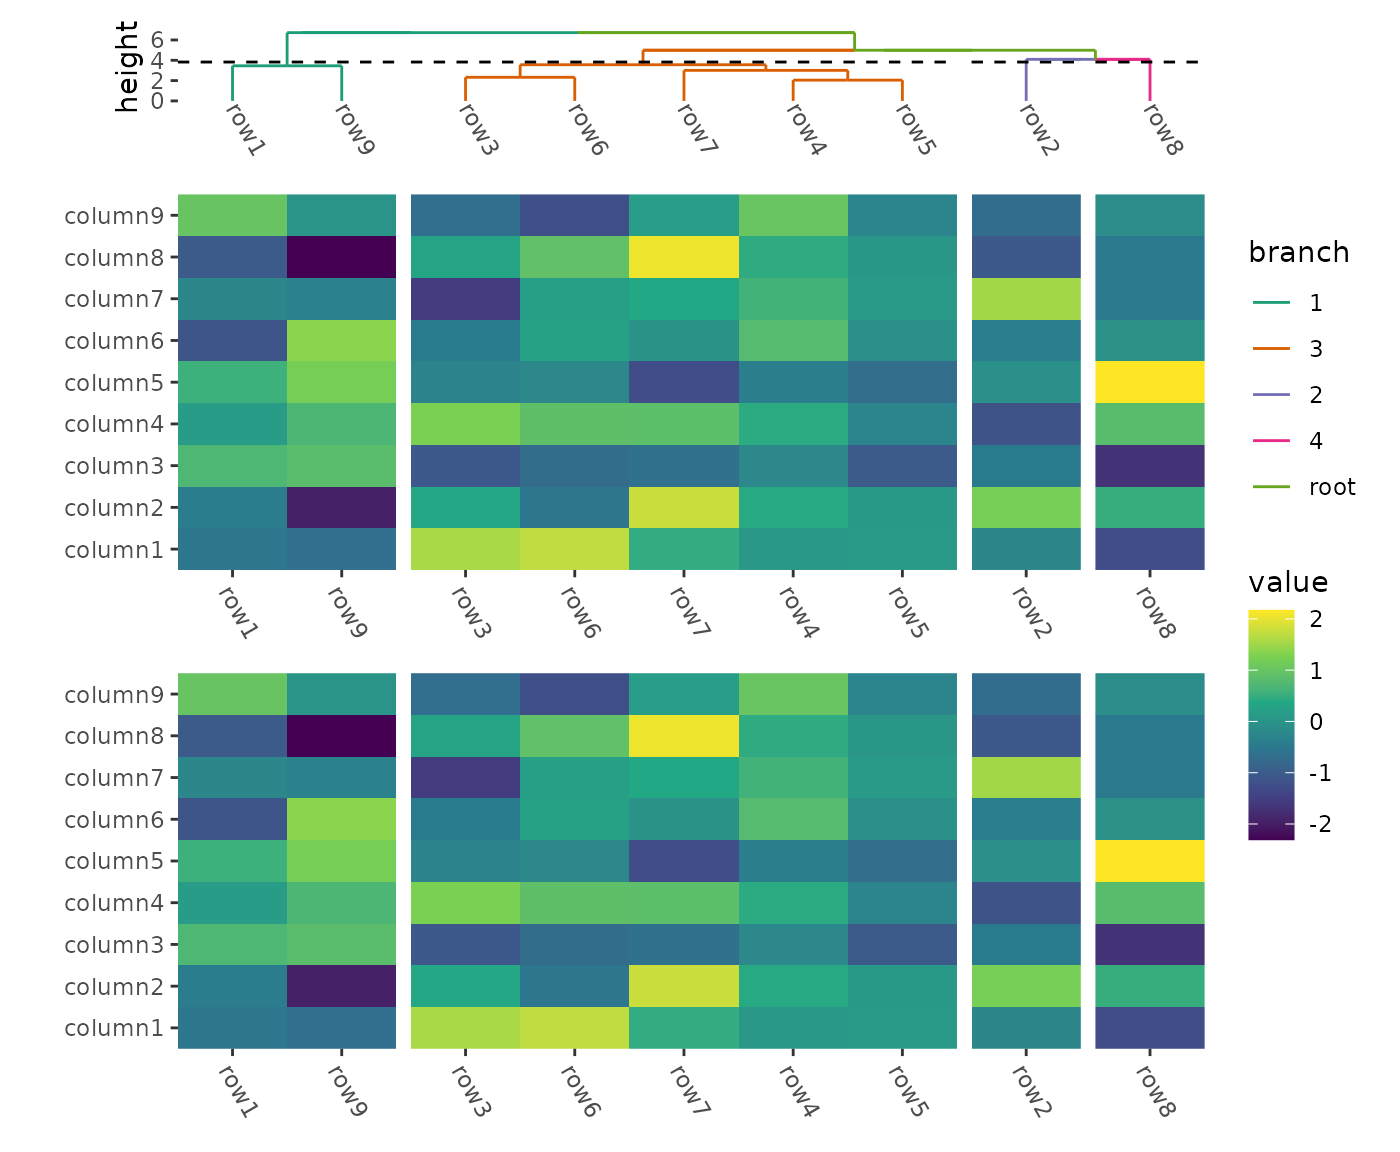
marginal plots
ggside(mpg, aes(displ, hwy, colour = class)) -
    # set default theme for all plots in the layout
    plot_theme(theme_bw()) +
    geom_point(size = 2) +
    # add top annotation
    anno_top(size = 0.3) -
    # set default theme for the top annotation
    plot_theme(theme_no_axes("tb")) +
    # add a plot in the top annotation
    ggfree() +
    geom_density(aes(displ, y = after_stat(density), colour = class), position = "stack") +
    anno_right(size = 0.3) -
    # set default theme for the right annotation
    plot_theme(theme_no_axes("lr")) +
    # add a plot in the right annotation
    ggfree() +
    geom_density(aes(x = after_stat(density), hwy, colour = class),
        position = "stack"
    ) +
    theme(axis.text.x = element_text(angle = 90, vjust = .5)) &
    scale_color_brewer(palette = "Dark2")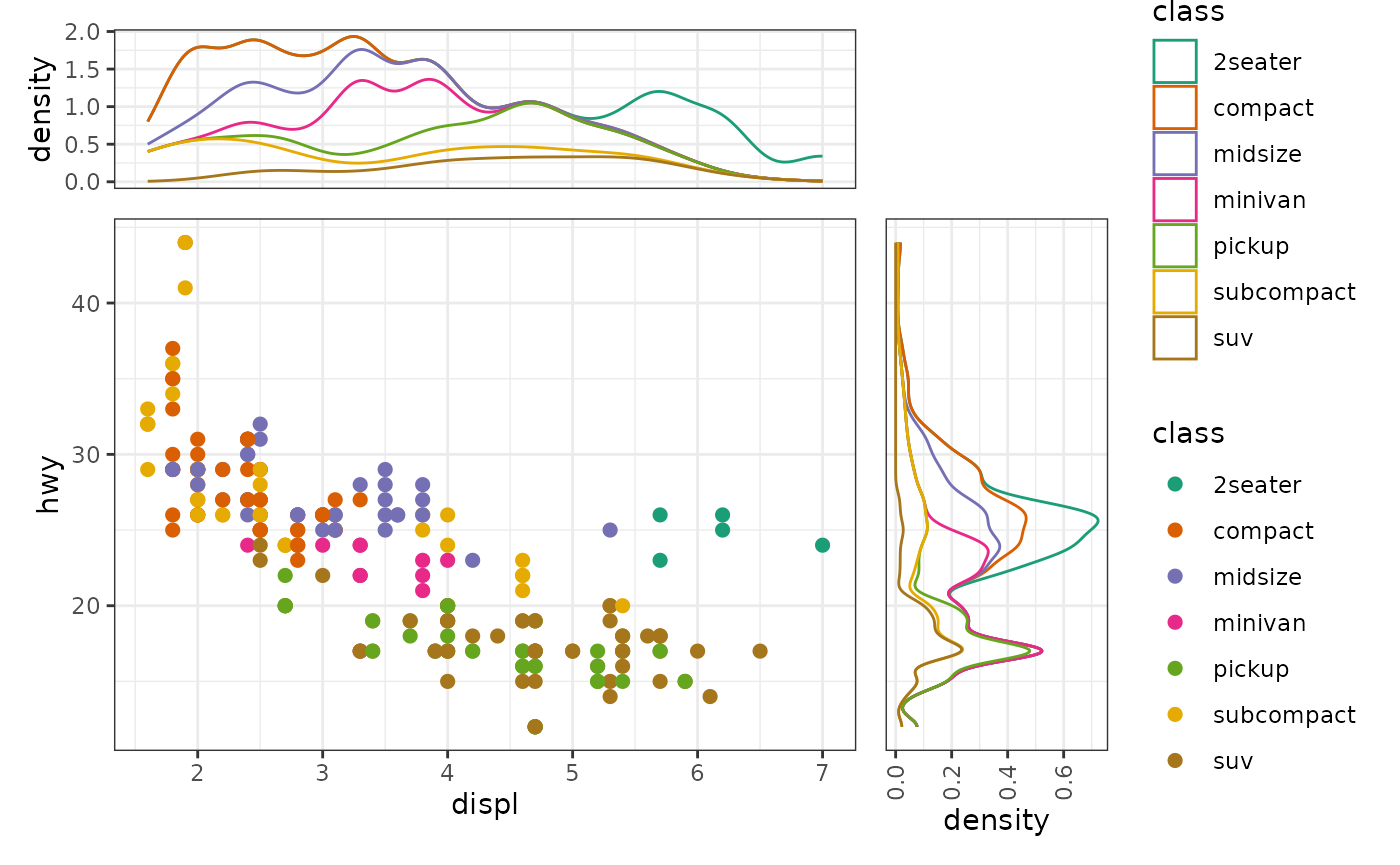
Session information
sessionInfo()
#> R version 4.4.2 (2024-10-31)
#> Platform: x86_64-pc-linux-gnu
#> Running under: Ubuntu 22.04.5 LTS
#>
#> Matrix products: default
#> BLAS:   /usr/lib/x86_64-linux-gnu/openblas-pthread/libblas.so.3
#> LAPACK: /usr/lib/x86_64-linux-gnu/openblas-pthread/libopenblasp-r0.3.20.so;  LAPACK version 3.10.0
#>
#> locale:
#>  [1] LC_CTYPE=C.UTF-8       LC_NUMERIC=C           LC_TIME=C.UTF-8
#>  [4] LC_COLLATE=C.UTF-8     LC_MONETARY=C.UTF-8    LC_MESSAGES=C.UTF-8
#>  [7] LC_PAPER=C.UTF-8       LC_NAME=C              LC_ADDRESS=C
#> [10] LC_TELEPHONE=C         LC_MEASUREMENT=C.UTF-8 LC_IDENTIFICATION=C
#>
#> time zone: UTC
#> tzcode source: system (glibc)
#>
#> attached base packages:
#> [1] stats     graphics  grDevices utils     datasets  methods   base
#>
#> other attached packages:
#> [1] ggalign_0.0.5 ggplot2_3.5.1
#>
#> loaded via a namespace (and not attached):
#>  [1] gtable_0.3.6       jsonlite_1.8.9     dplyr_1.1.4        compiler_4.4.2
#>  [5] tidyselect_1.2.1   jquerylib_0.1.4    systemfonts_1.1.0  scales_1.3.0
#>  [9] textshaping_0.4.0  yaml_2.3.10        fastmap_1.2.0      R6_2.5.1
#> [13] labeling_0.4.3     generics_0.1.3     knitr_1.49         tibble_3.2.1
#> [17] desc_1.4.3         munsell_0.5.1      RColorBrewer_1.1-3 bslib_0.8.0
#> [21] pillar_1.9.0       rlang_1.1.4        utf8_1.2.4         cachem_1.1.0
#> [25] xfun_0.49          fs_1.6.5           sass_0.4.9         viridisLite_0.4.2
#> [29] cli_3.6.3          pkgdown_2.1.1      withr_3.0.2        magrittr_2.0.3
#> [33] digest_0.6.37      grid_4.4.2         lifecycle_1.0.4    vctrs_0.6.5
#> [37] evaluate_1.0.1     glue_1.8.0         farver_2.1.2       ragg_1.3.3
#> [41] fansi_1.0.6        colorspace_2.1-1   rmarkdown_2.29     tools_4.4.2
#> [45] pkgconfig_2.0.3    htmltools_0.5.8.1