In this thread, we’ll use ggalign to draw all the
heatmap in https://jokergoo.github.io/ComplexHeatmap-reference/book/more-examples.html.
Add more information for gene expression matrix
expr <- read_example("gene_expression.rds")
mat <- as.matrix(expr[, grep("cell", colnames(expr))])
base_mean <- rowMeans(mat)
mat_scaled <- t(apply(mat, 1, scale))
type <- gsub("s\\d+_", "", colnames(mat))

stack_alignh(mat_scaled) +
    stack_active(sizes = c(0.2, 1, 1)) +
    # group stack rows into 5 groups
    align_kmeans(centers = 5L) +
    # add a block plot for each group in the stack
    ggalign(size = unit(1, "cm"), data = NULL) +
    geom_tile(aes(x = 1, fill = factor(.panel))) +
    scale_fill_brewer(palette = "Dark2", name = "Kmeans group") +
    scale_x_continuous(breaks = NULL, name = NULL) +
    # add a heatmap plot in the stack
    ggheatmap() -
    plot_align(free_spaces = "l") +
    scale_y_continuous(breaks = NULL) +
    scale_fill_viridis_c(option = "magma") +
    # add dendrogram for this heatmap
    anno_top() +
    align_dendro() +
    # add a block for the heatmap column
    ggalign(data = type, size = unit(1, "cm")) +
    geom_tile(aes(y = 1, fill = factor(value))) +
    scale_y_continuous(breaks = NULL, name = NULL) +
    scale_fill_brewer(
        palette = "Set1", name = "type",
        guide = guide_legend(position = "top")
    ) +
    # add another heatmap in the stack and set the heatmap body width
    ggheatmap(base_mean, width = unit(2, "cm")) +
    scale_y_continuous(breaks = NULL) +
    scale_x_continuous(name = "base mean", breaks = FALSE) +
    scale_fill_gradientn(colours = c("#2600D1FF", "white", "#EE3F3FFF")) +
    # set the active context of the heatmap to the top
    # and set the size of the top stack
    anno_top(size = unit(4, "cm")) +
    # add box plot in the heatmap top
    ggalign() +
    geom_boxplot(aes(y = value, fill = factor(.extra_panel))) +
    scale_x_continuous(expand = expansion(), breaks = NULL) +
    scale_fill_brewer(
        palette = "Dark2", name = "base mean",
        guide = guide_legend(position = "top")
    ) +
    theme(axis.title.y = element_blank()) +
    # we move into the stack layout
    stack_active() +
    # add a point plot
    ggalign(data = expr$length, size = unit(2, "cm")) +
    geom_point(aes(x = value)) +
    labs(x = "length") +
    theme(
        panel.border = element_rect(fill = NA),
        axis.text.x = element_text(angle = -60, hjust = 0)
    ) +
    # add another heatmap and set the heatmap body width
    ggheatmap(expr$type, width = unit(2, "cm")) +
    scale_fill_brewer(palette = "Set3", name = "gene type") +
    scale_x_continuous(breaks = NULL, name = "gene type") +
    # add barplot in the top annotation, and remove the spaces in the y-axis
    anno_top() -
    plot_align(free_spaces = "lr") +
    ggalign(limits = FALSE) +
    geom_bar(
        aes(.extra_panel, fill = factor(value)),
        position = position_fill()
    ) +
    scale_y_continuous(expand = expansion()) +
    scale_fill_brewer(palette = "Set3", name = "gene type", guide = "none") -
    plot_theme(plot.margin = margin()) &
    theme(
        plot.background = element_blank(), panel.background = element_blank(),
        legend.background = element_blank()
    )
#> → heatmap built with `geom_tile()`
#> → heatmap built with `geom_tile()`
#> → heatmap built with `geom_tile()`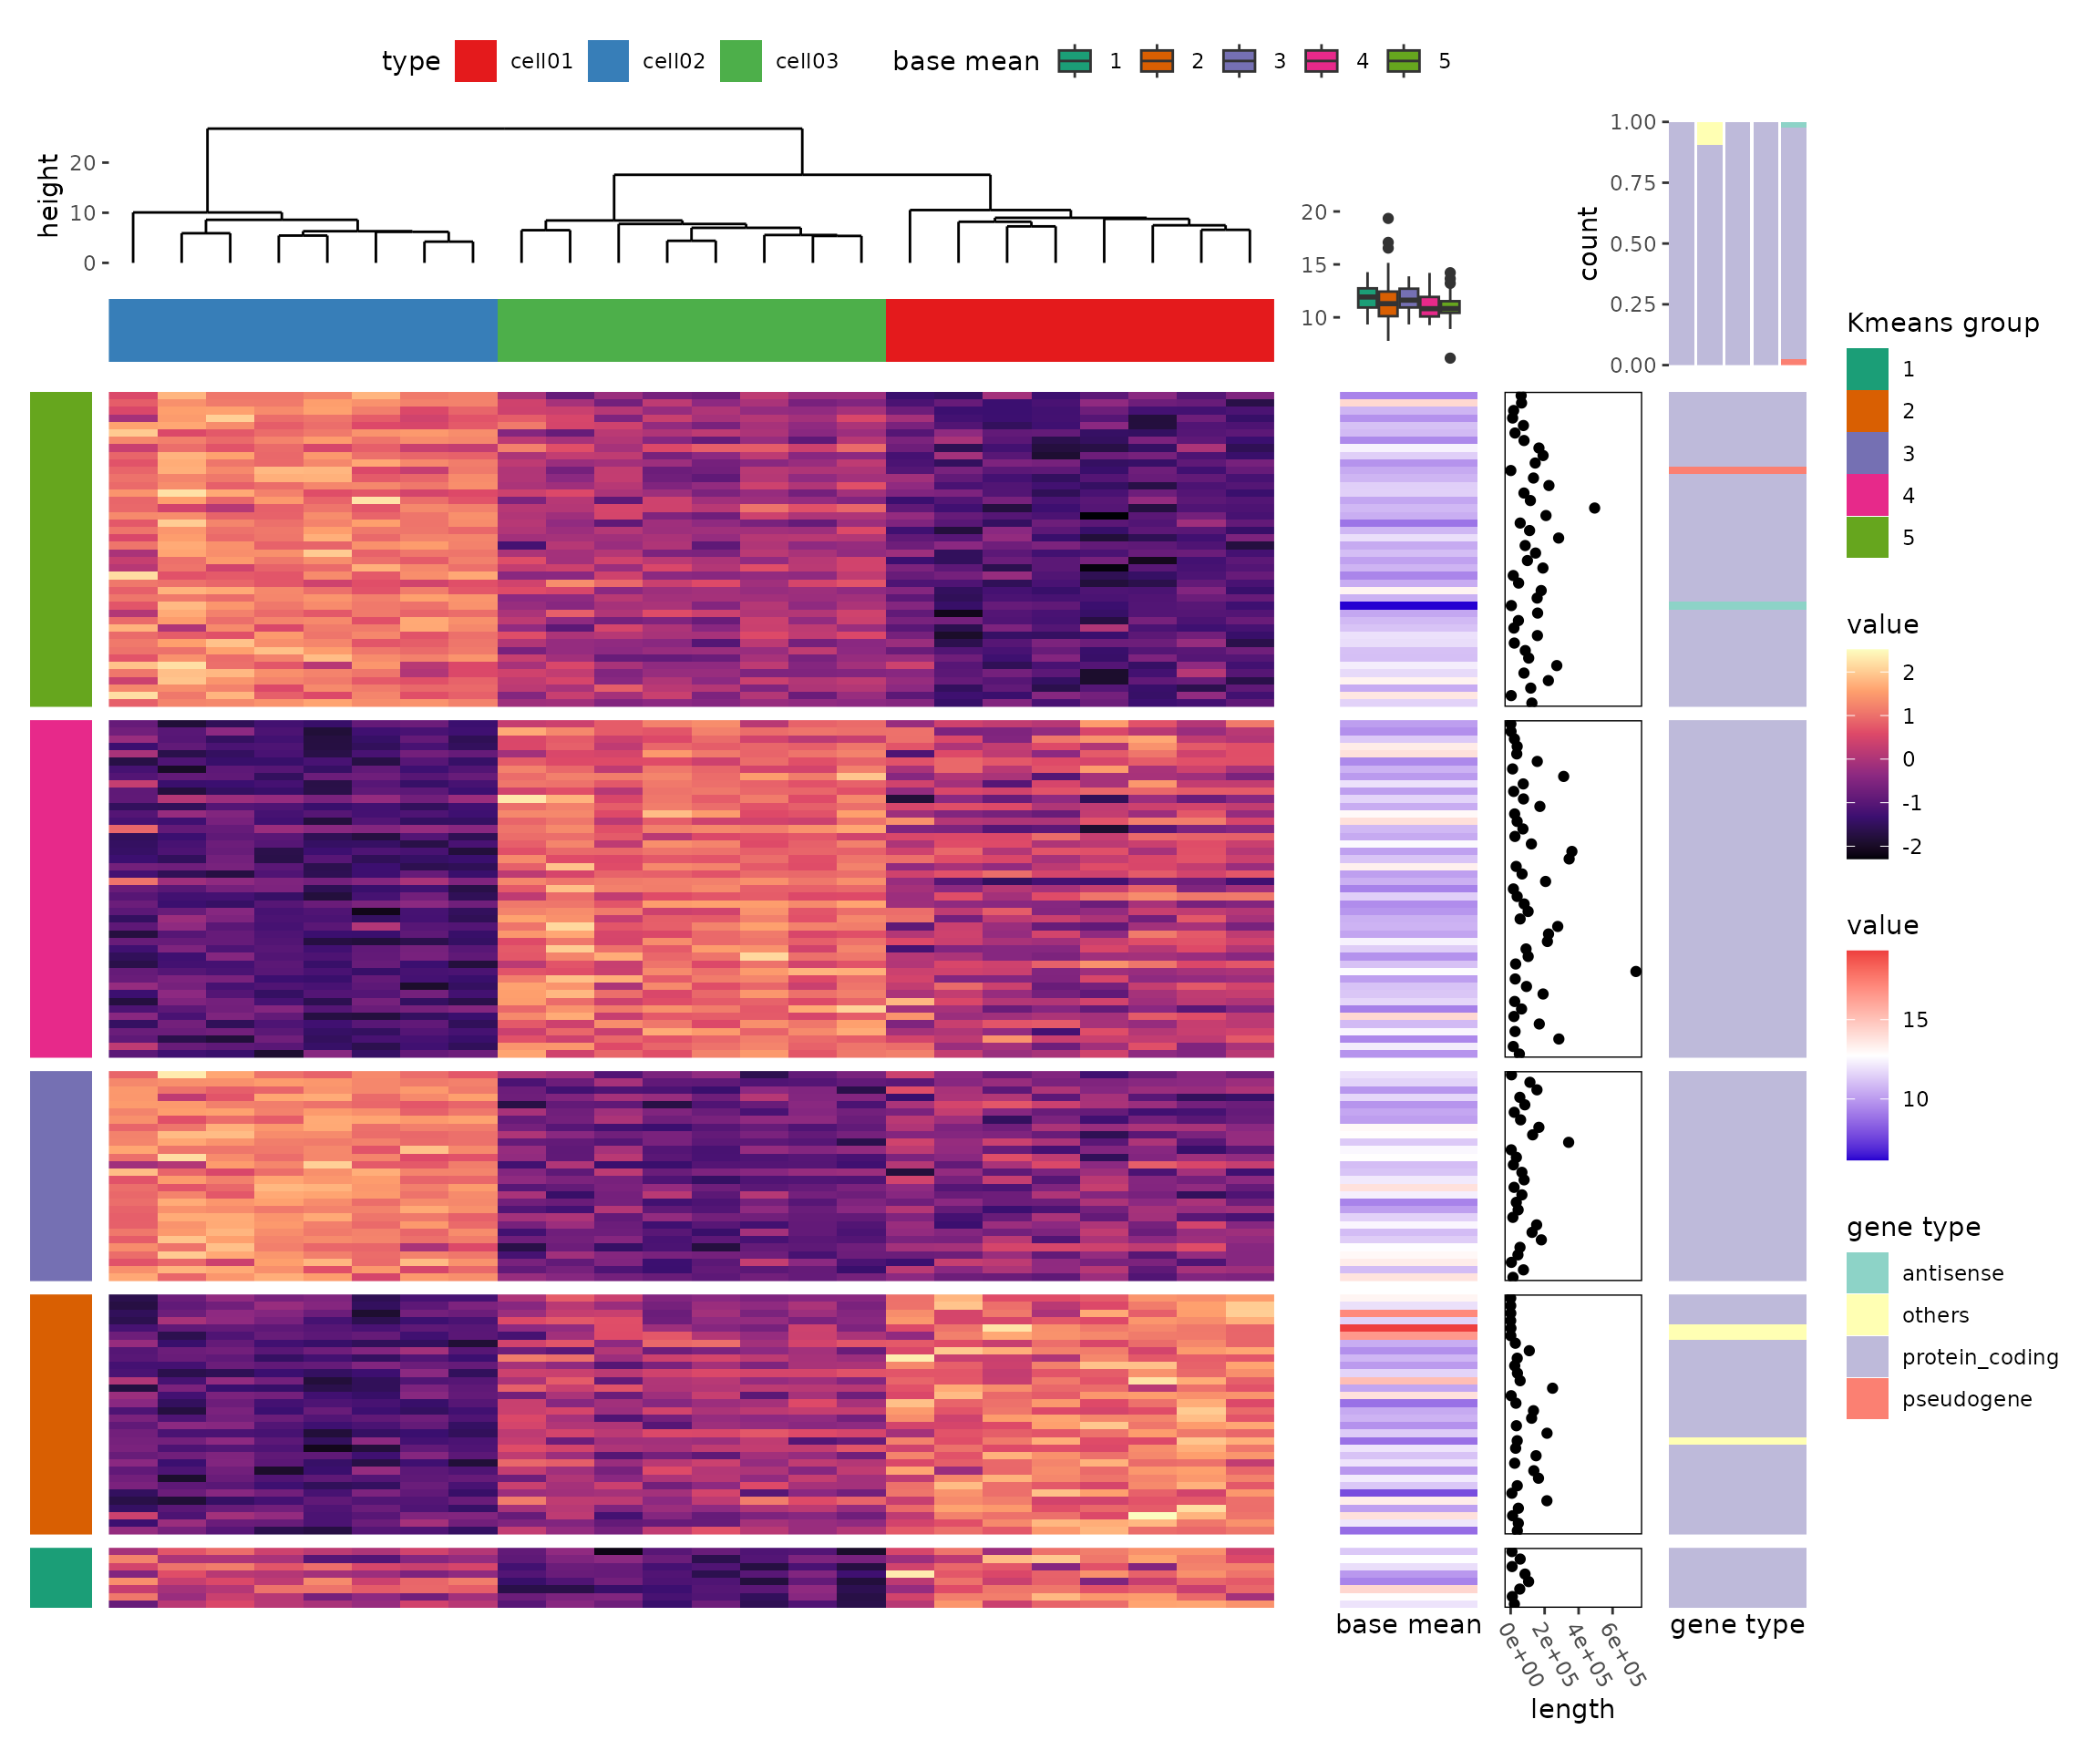
The measles vaccine heatmap
mat <- read_example("measles.rds")
ggheatmap(mat, filling = FALSE) +
    geom_tile(aes(fill = value), color = "white") +
    scale_fill_gradientn(
        colours = c("white", "cornflowerblue", "yellow", "red"),
        values = scales::rescale(c(0, 800, 1000, 127000), c(0, 1))
    ) +
    theme(axis.text.x = element_text(angle = -60, hjust = 0)) +
    anno_right() +
    align_dendro(plot_dendrogram = FALSE) +
    anno_top(size = unit(2, "cm")) +
    ggalign(data = rowSums) +
    geom_bar(aes(y = value), fill = "#FFE200", stat = "identity") +
    scale_y_continuous(expand = expansion()) +
    ggtitle("Measles cases in US states 1930-2001\nVaccine introduced 1961") +
    theme(plot.title = element_text(hjust = 0.5)) +
    anno_right(size = unit(2, "cm")) +
    ggalign(data = rowSums) +
    geom_bar(aes(x = value),
        fill = "#FFE200", stat = "identity",
        orientation = "y"
    ) +
    scale_x_continuous(expand = expansion()) +
    theme(axis.text.x = element_text(angle = -60, hjust = 0))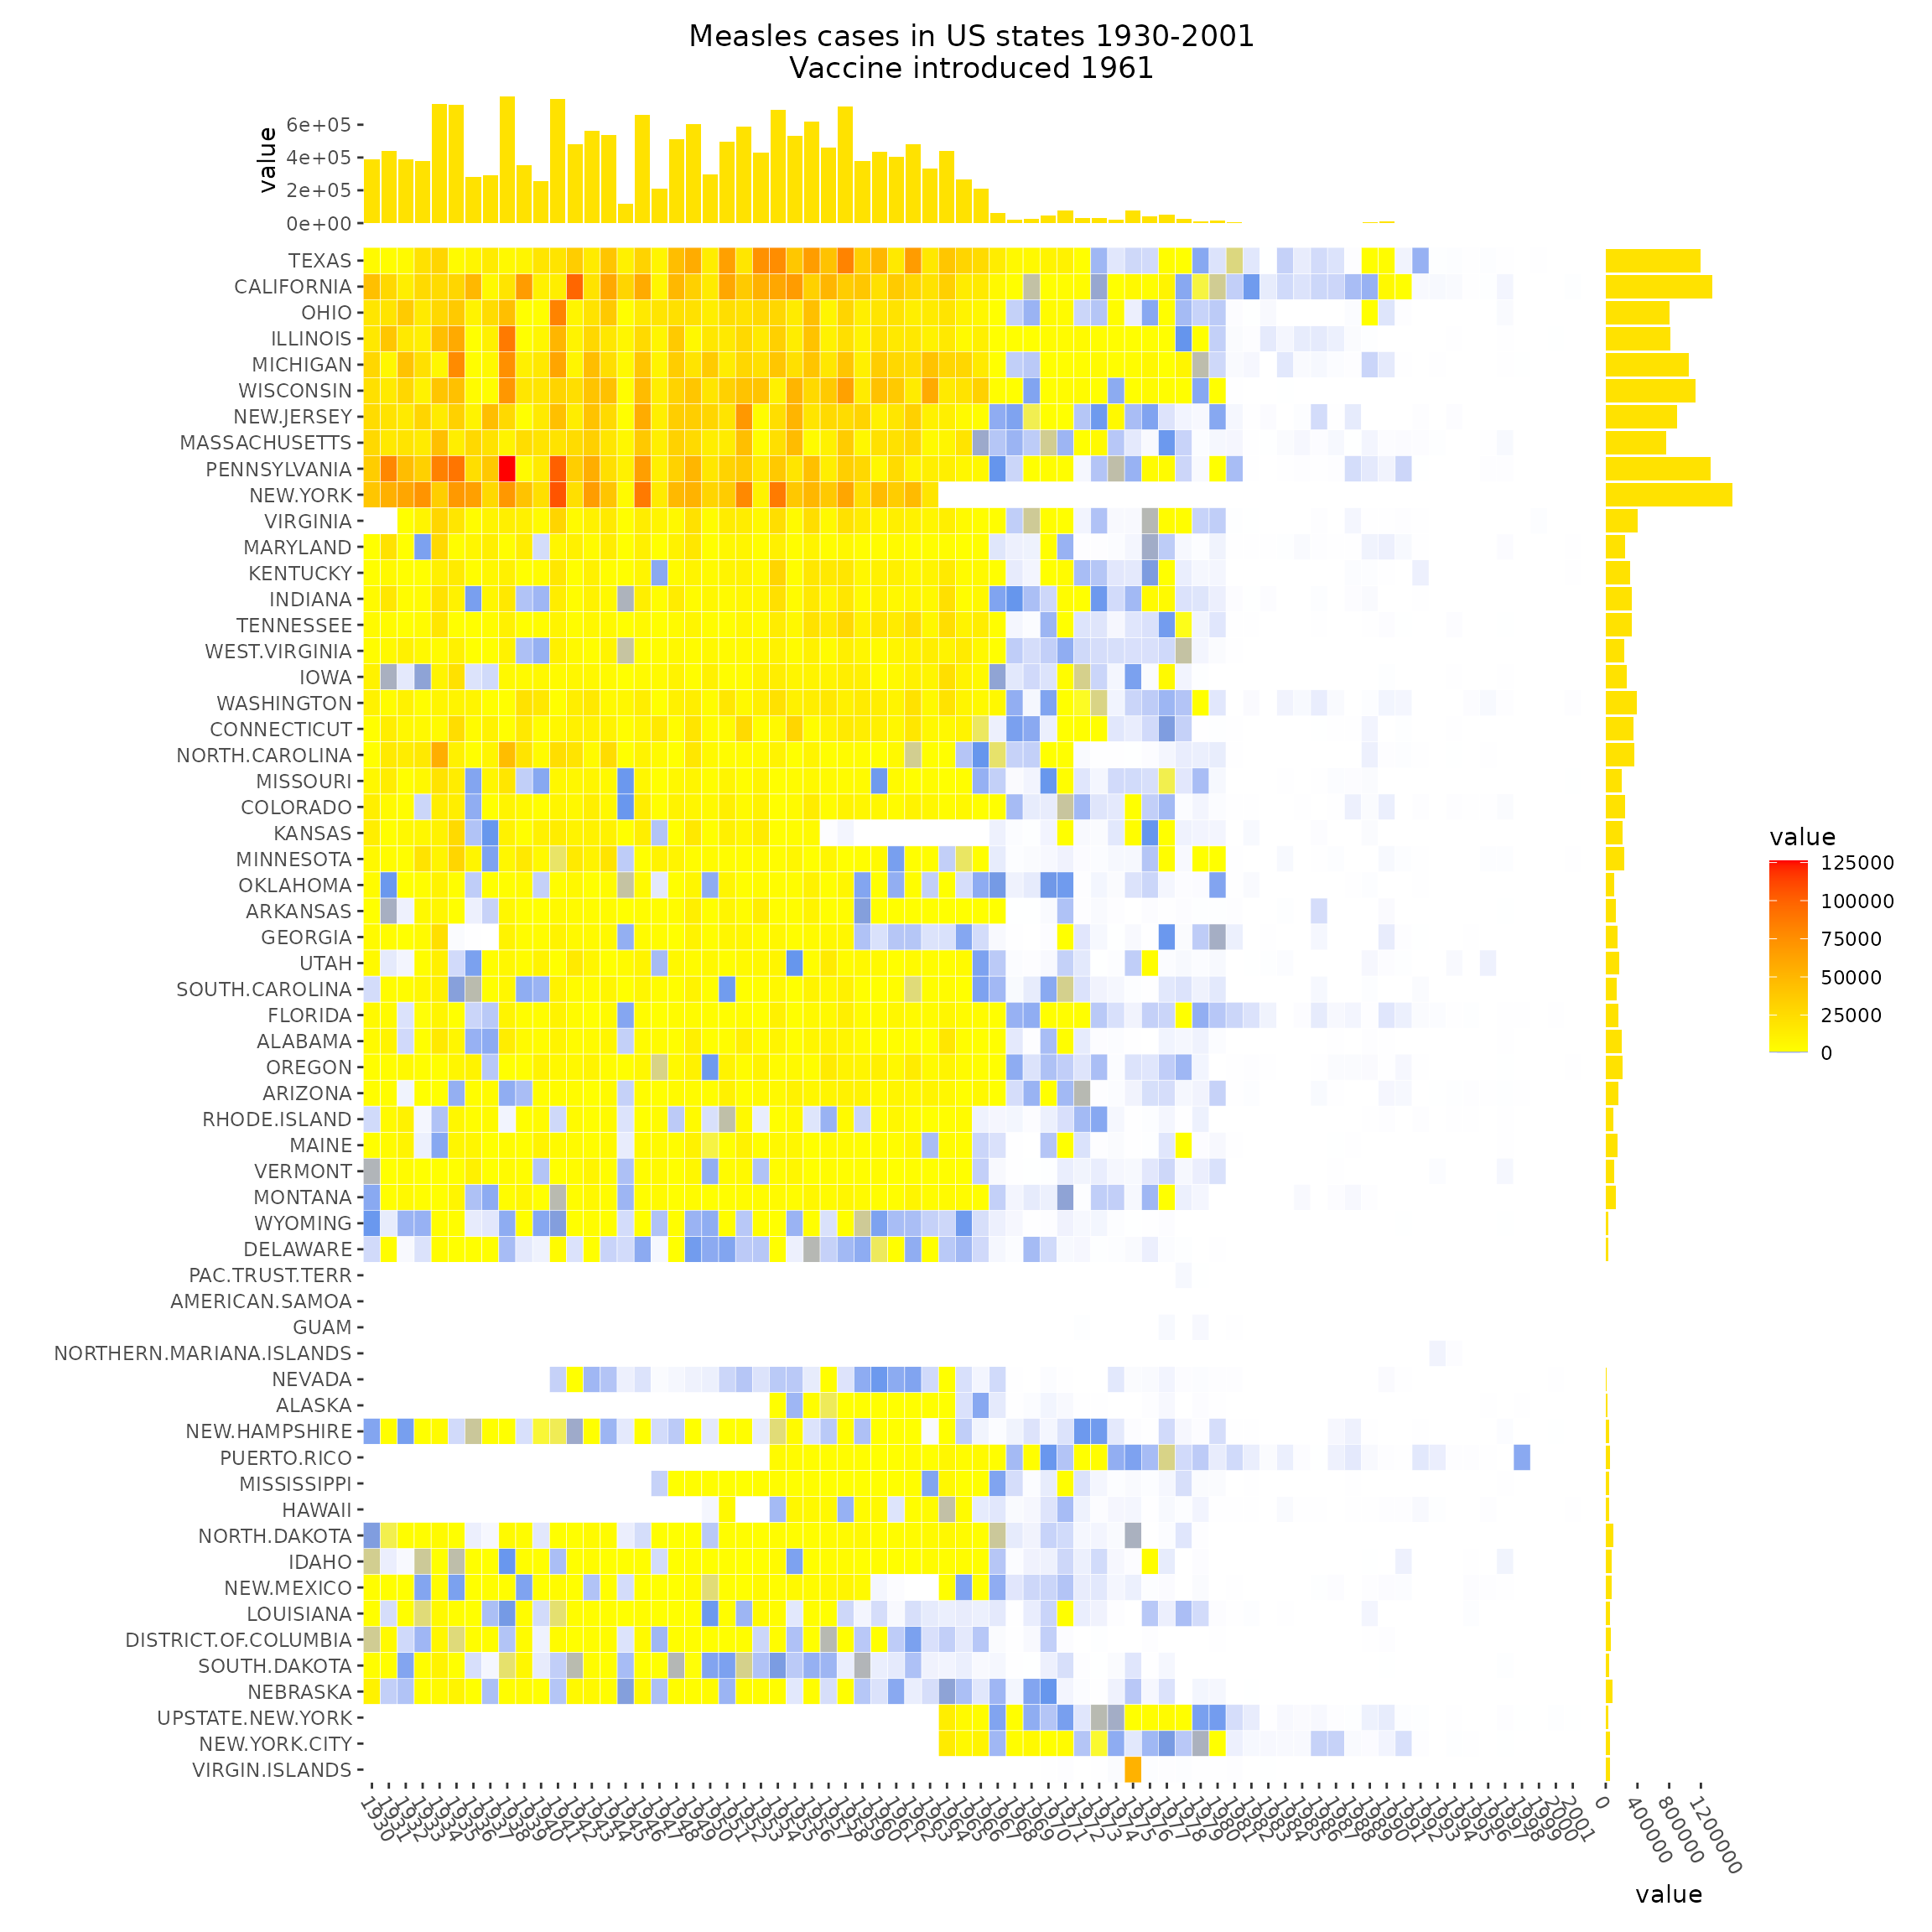
Session information
sessionInfo()
#> R version 4.4.2 (2024-10-31)
#> Platform: x86_64-pc-linux-gnu
#> Running under: Ubuntu 22.04.5 LTS
#>
#> Matrix products: default
#> BLAS:   /usr/lib/x86_64-linux-gnu/openblas-pthread/libblas.so.3
#> LAPACK: /usr/lib/x86_64-linux-gnu/openblas-pthread/libopenblasp-r0.3.20.so;  LAPACK version 3.10.0
#>
#> locale:
#>  [1] LC_CTYPE=C.UTF-8       LC_NUMERIC=C           LC_TIME=C.UTF-8
#>  [4] LC_COLLATE=C.UTF-8     LC_MONETARY=C.UTF-8    LC_MESSAGES=C.UTF-8
#>  [7] LC_PAPER=C.UTF-8       LC_NAME=C              LC_ADDRESS=C
#> [10] LC_TELEPHONE=C         LC_MEASUREMENT=C.UTF-8 LC_IDENTIFICATION=C
#>
#> time zone: UTC
#> tzcode source: system (glibc)
#>
#> attached base packages:
#> [1] stats     graphics  grDevices utils     datasets  methods   base
#>
#> other attached packages:
#> [1] ggalign_0.0.5 ggplot2_3.5.1
#>
#> loaded via a namespace (and not attached):
#>  [1] gtable_0.3.6       jsonlite_1.8.9     dplyr_1.1.4        compiler_4.4.2
#>  [5] tidyselect_1.2.1   jquerylib_0.1.4    systemfonts_1.1.0  scales_1.3.0
#>  [9] textshaping_0.4.0  yaml_2.3.10        fastmap_1.2.0      R6_2.5.1
#> [13] labeling_0.4.3     generics_0.1.3     knitr_1.49         tibble_3.2.1
#> [17] desc_1.4.3         munsell_0.5.1      bslib_0.8.0        pillar_1.9.0
#> [21] RColorBrewer_1.1-3 rlang_1.1.4        utf8_1.2.4         cachem_1.1.0
#> [25] xfun_0.49          fs_1.6.5           sass_0.4.9         viridisLite_0.4.2
#> [29] cli_3.6.3          pkgdown_2.1.1      withr_3.0.2        magrittr_2.0.3
#> [33] digest_0.6.37      grid_4.4.2         lifecycle_1.0.4    vctrs_0.6.5
#> [37] evaluate_1.0.1     glue_1.8.0         farver_2.1.2       ragg_1.3.3
#> [41] fansi_1.0.6        colorspace_2.1-1   rmarkdown_2.29     tools_4.4.2
#> [45] pkgconfig_2.0.3    htmltools_0.5.8.1