set.seed(123)
small_mat <- matrix(rnorm(81), nrow = 9)
rownames(small_mat) <- paste0("row", seq_len(nrow(small_mat)))
colnames(small_mat) <- paste0("column", seq_len(ncol(small_mat)))
Scales
Scales are handled as the usual in ggplot2, but for position scales
in the heatmap body or in the specific axis of align_*()
plots (referring to the x-axis for vertical stacks or the y-axis for
horizontal stacks), we introduce some adjustments to better align with
the layout concept.
breaks
breaks and labels are typically handled in
a similar manner of discrete scale, thought you can provide as a
continuous scale.
breaks should be one of:
- `NULL` for no breaks

- `waiver()` for the default breaks (the full data index or `NULL` if no
data names and `labels` is `waiver()`)

- A character vector of breaks (rownames / colunames of the matrix).

- A numeric vector of data index (floating number were not allowed).

- A function that takes the data limits or the data index as input and
returns breaks as output. Also accepts rlang lambda function notation.
ggheatmap(small_mat) + scale_x_continuous(breaks = NULL)
ggheatmap(small_mat) + scale_x_continuous()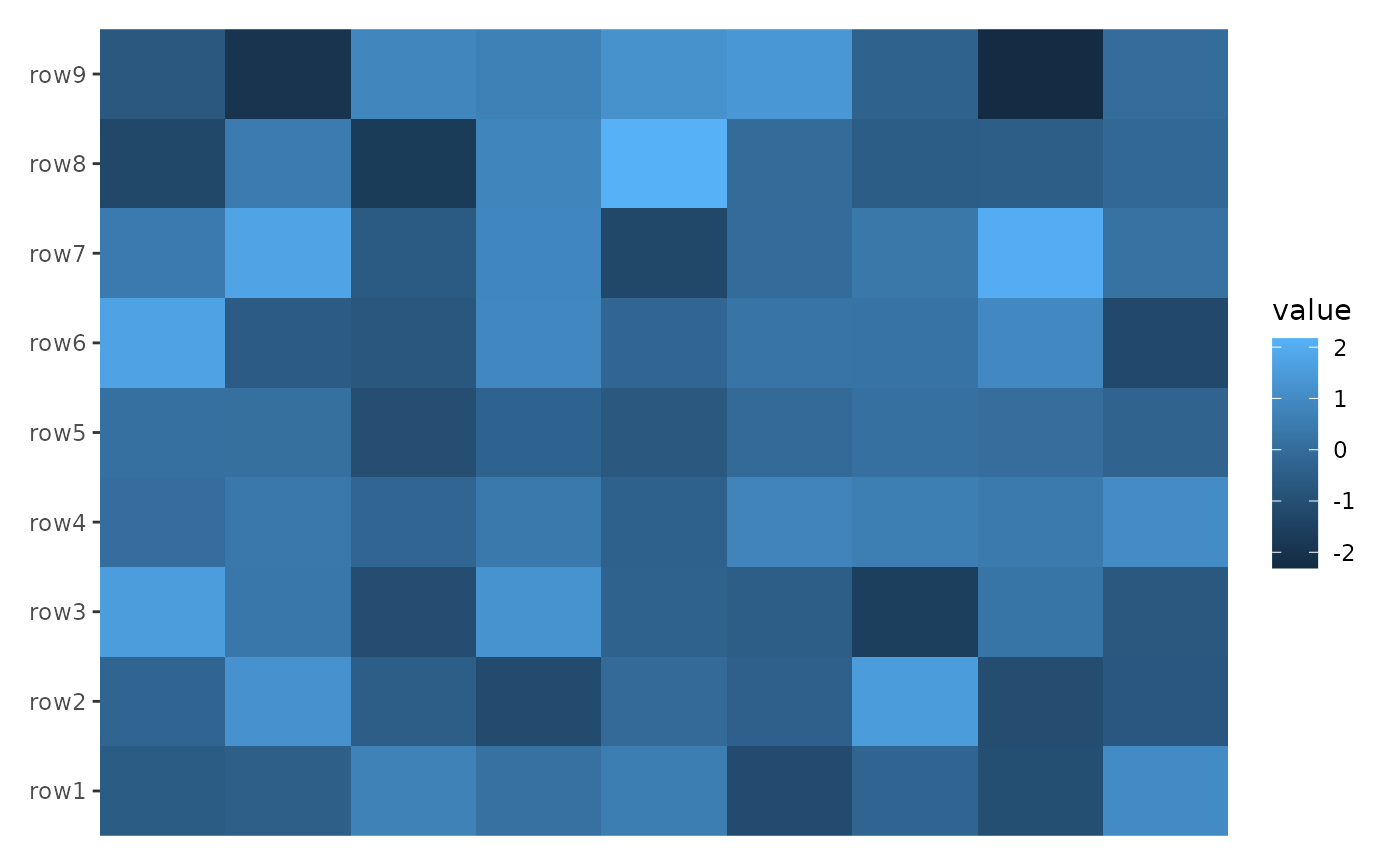
no_names <- small_mat
colnames(no_names) <- NULL
ggheatmap(no_names) + scale_x_continuous()
ggheatmap(small_mat) + scale_x_continuous(breaks = c("column3", "column5"))
ggheatmap(small_mat) + scale_x_continuous(breaks = c(3, 5))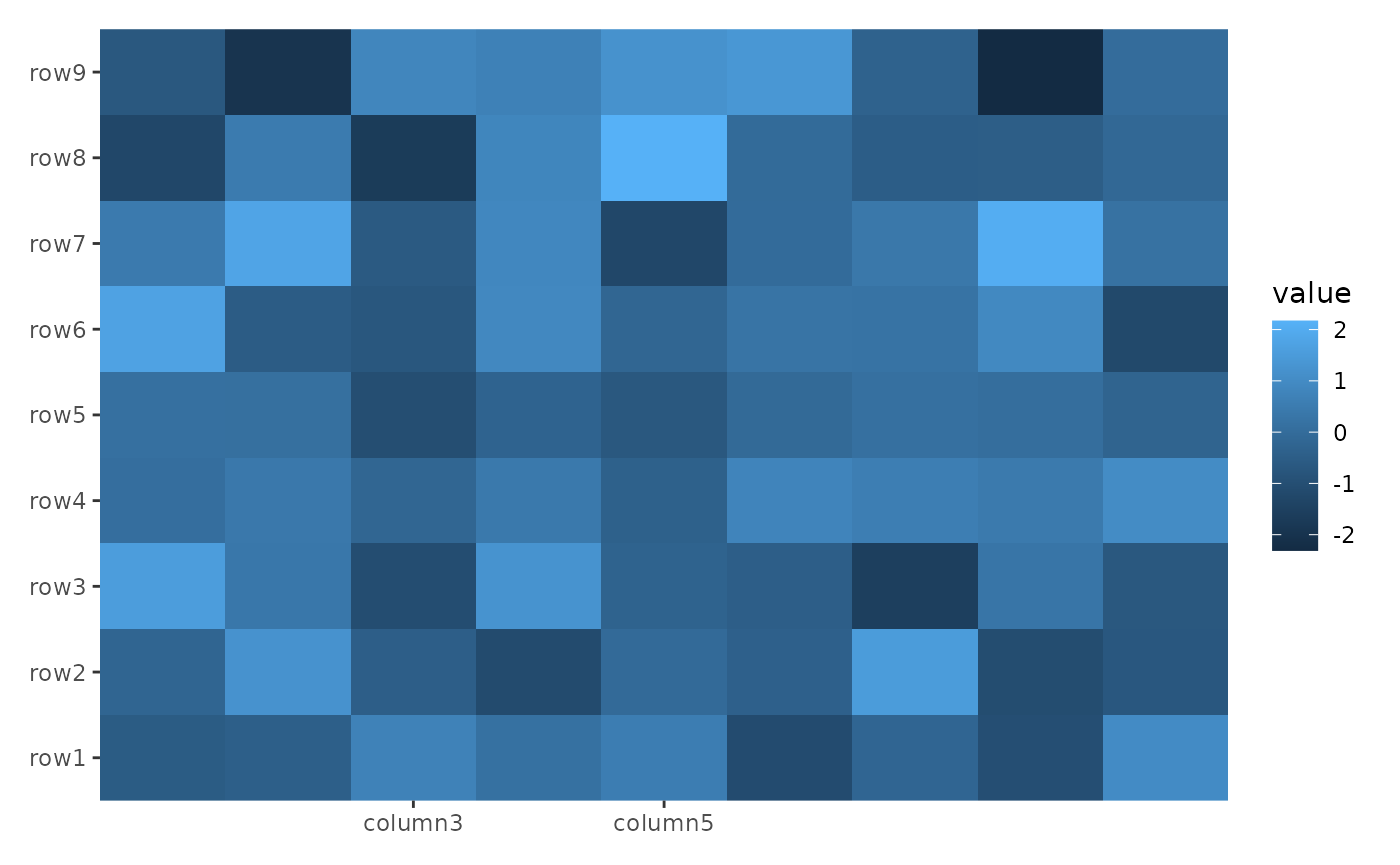
Floating number were not allowed.
ggheatmap(small_mat) + scale_x_continuous(breaks = c(3.5, 5))
#> Error in `scale_x_continuous()`:
#> ! Can't convert from `breaks` <double> to <integer> due to loss of precision.
#> • Locations: 1
labels
labels should be one of:
- `NULL` for no labels

- `waiver()` for the default labels (data names)

- A character vector giving labels (must be same length as breaks)

- An expression vector (must be the same length as breaks). See `?plotmath`
for details.

- A function that takes the data names (or breaks if data has no names) as
input and returns labels as output. This can be also a rlang lambda
function.
ggheatmap(small_mat) + scale_x_continuous(labels = NULL)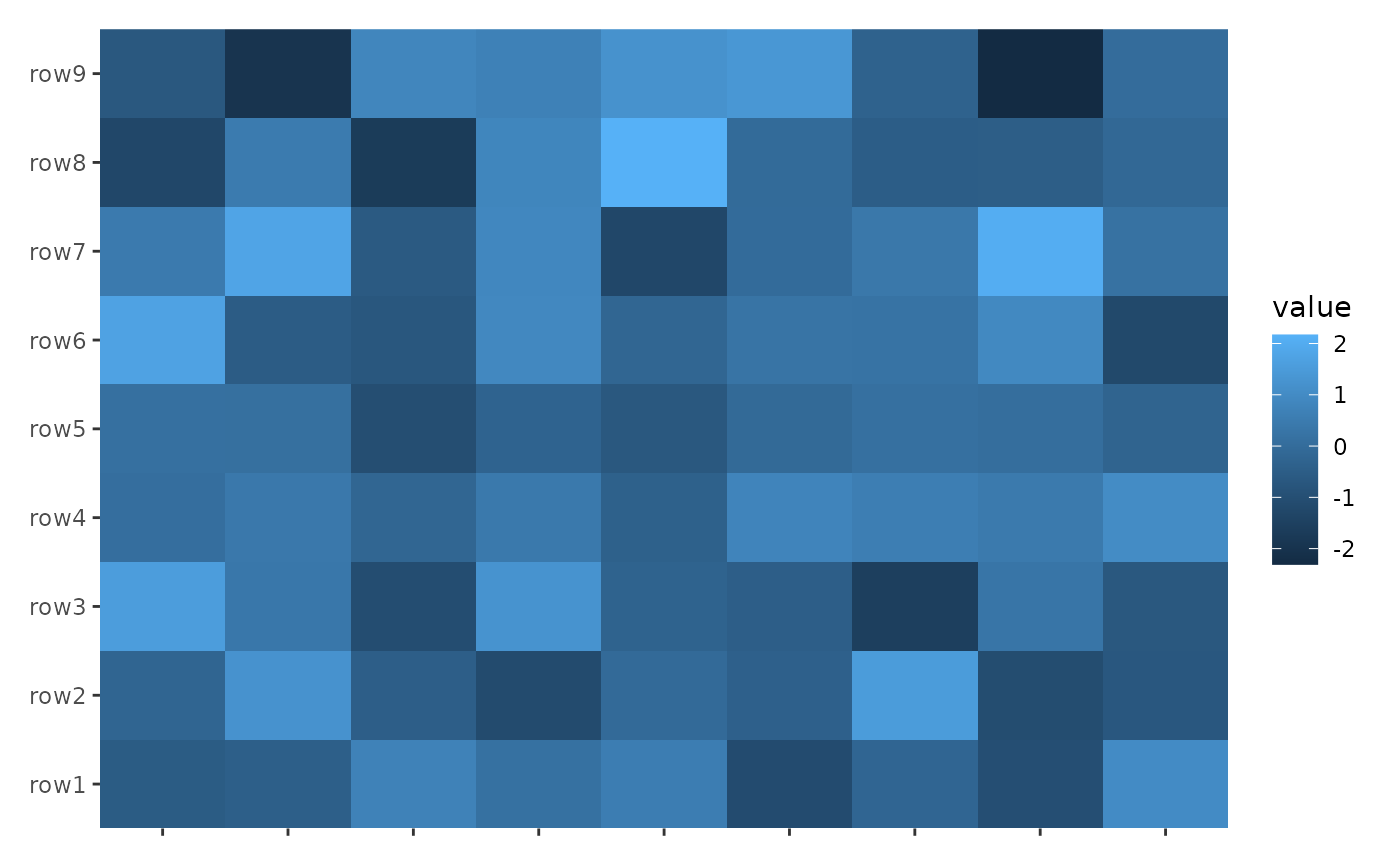
ggheatmap(small_mat) + scale_x_continuous()
ggheatmap(small_mat) +
    scale_x_continuous(labels = letters[seq_len(ncol(small_mat))])
ggheatmap(small_mat) +
    scale_x_continuous(breaks = c(3, 5), labels = c("a", "b"))
data ordering
Both breaks and labels should be provided
in the original scale of the raw matrix, the internal will reorder them
accordingly if you reorder the heatmap rows/columns.
align_order will reorder the heatmap rows/columns based
on the weights returned from wts function, or you can
directly provide the ordering integer or character index. Here we
calculate the final index by the means and order the heatmap
columns.
We provide the labels in the original order here, the layout will order them accordingly.
index <- order(colMeans(small_mat))
xlabels <- letters[seq_len(ncol(small_mat))]
print(xlabels[index])
#> [1] "c" "h" "i" "g" "f" "e" "a" "b" "d"

ggheatmap(small_mat) +
    scale_x_continuous(labels = xlabels) +
    hmanno("t") +
    align_order(index)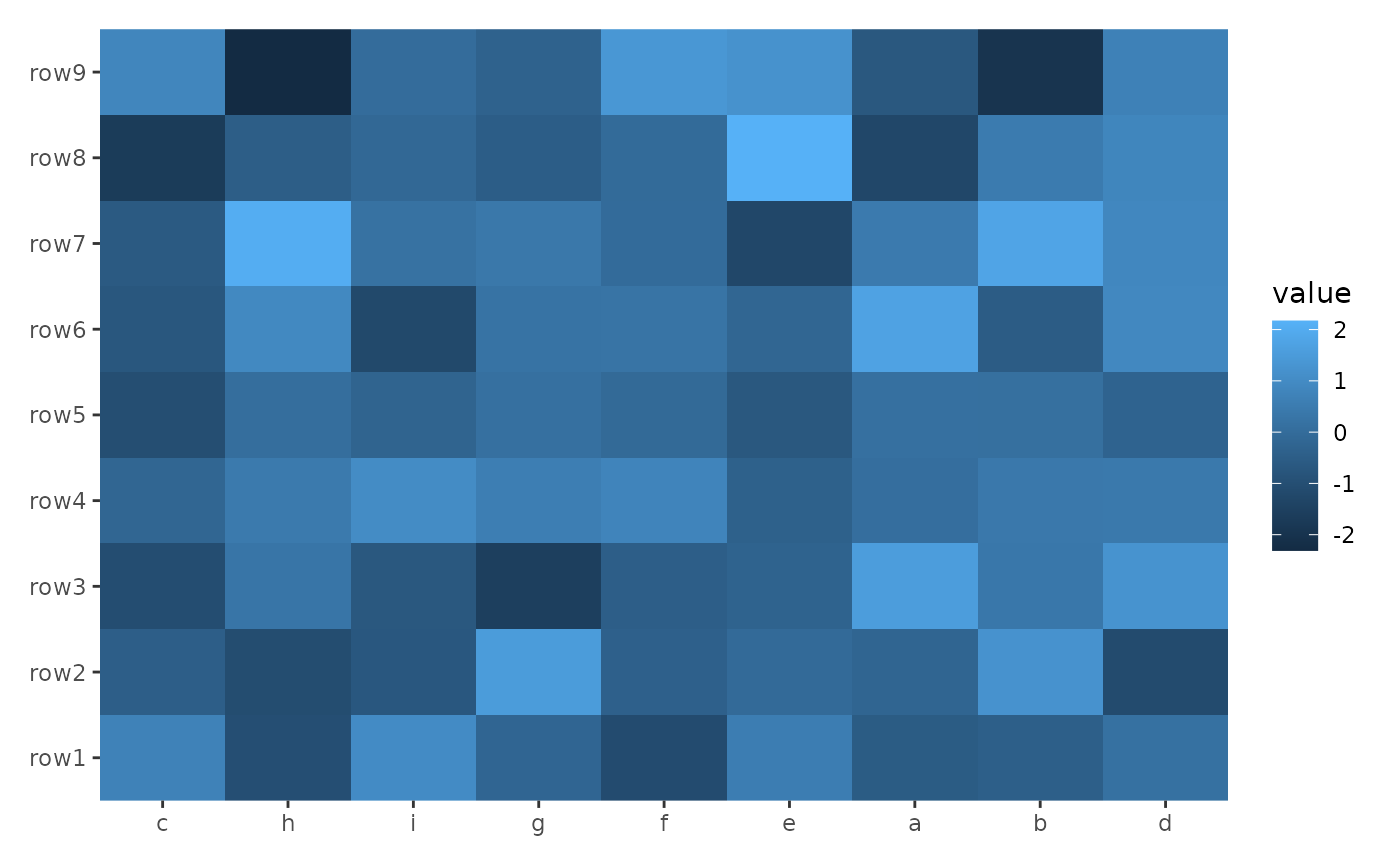
expand
By default, we utilize zero expand for the heatmap or for the
specific axis of align_*() plots (meaning the x-axis for
vertical stacks or the y-axis for horizontal stacks). This is typically
the desired setting. If you wish to introduce expansion, you must
manually adjust it and apply it to each plot to ensure proper axis
alignment.
ggheatmap(small_mat) +
    scale_x_continuous(expand = expansion(mult = 0.1)) +
    hmanno("t") +
    align_dendro(aes(color = branch), k = 3L) +
    scale_x_continuous(expand = expansion(mult = 0.1))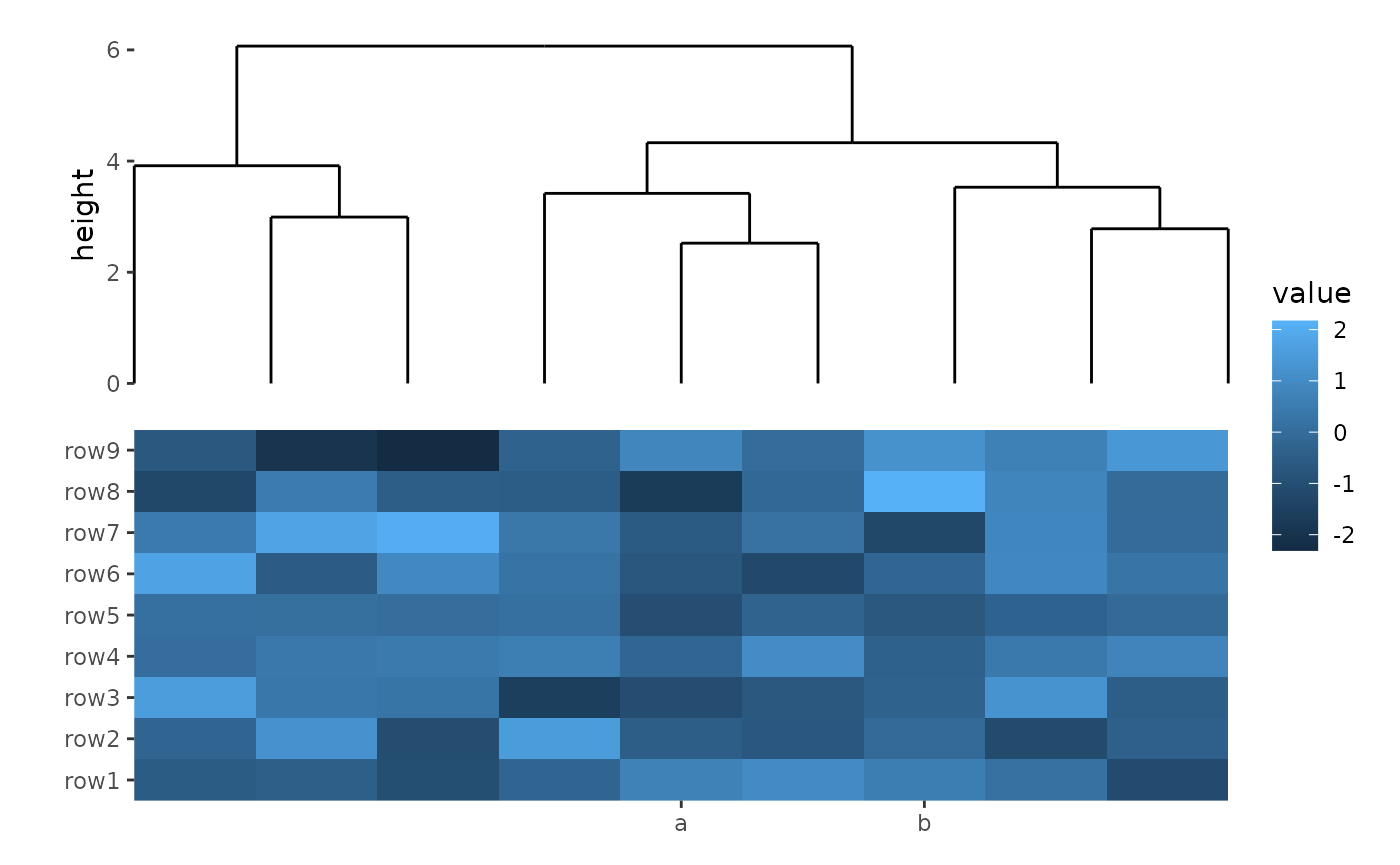
Facets
When working with facets, manual configuration of panel using the
facet_*() function is not possible since the internal will
use facet_grid to set the row/column groups defined by
align_*() functions. However, you can provide
facet_grid() or facet_null() (if no panel) to
control other arguments except rows or cols. A
common usage case is to change the panel strip text.
The default theme in this package will always remove the panel strip
text, you can override this behaviour with
theme(strip.text = element_text()). This allows us to add
the panel title in the plot area.
ggheatmap(small_mat) +
    facet_grid(labeller = labeller(.column_panel = function(x) letters[as.integer(x)])) +
    theme(strip.text = element_text()) +
    hmanno("top") +
    align_kmeans(centers = 3L)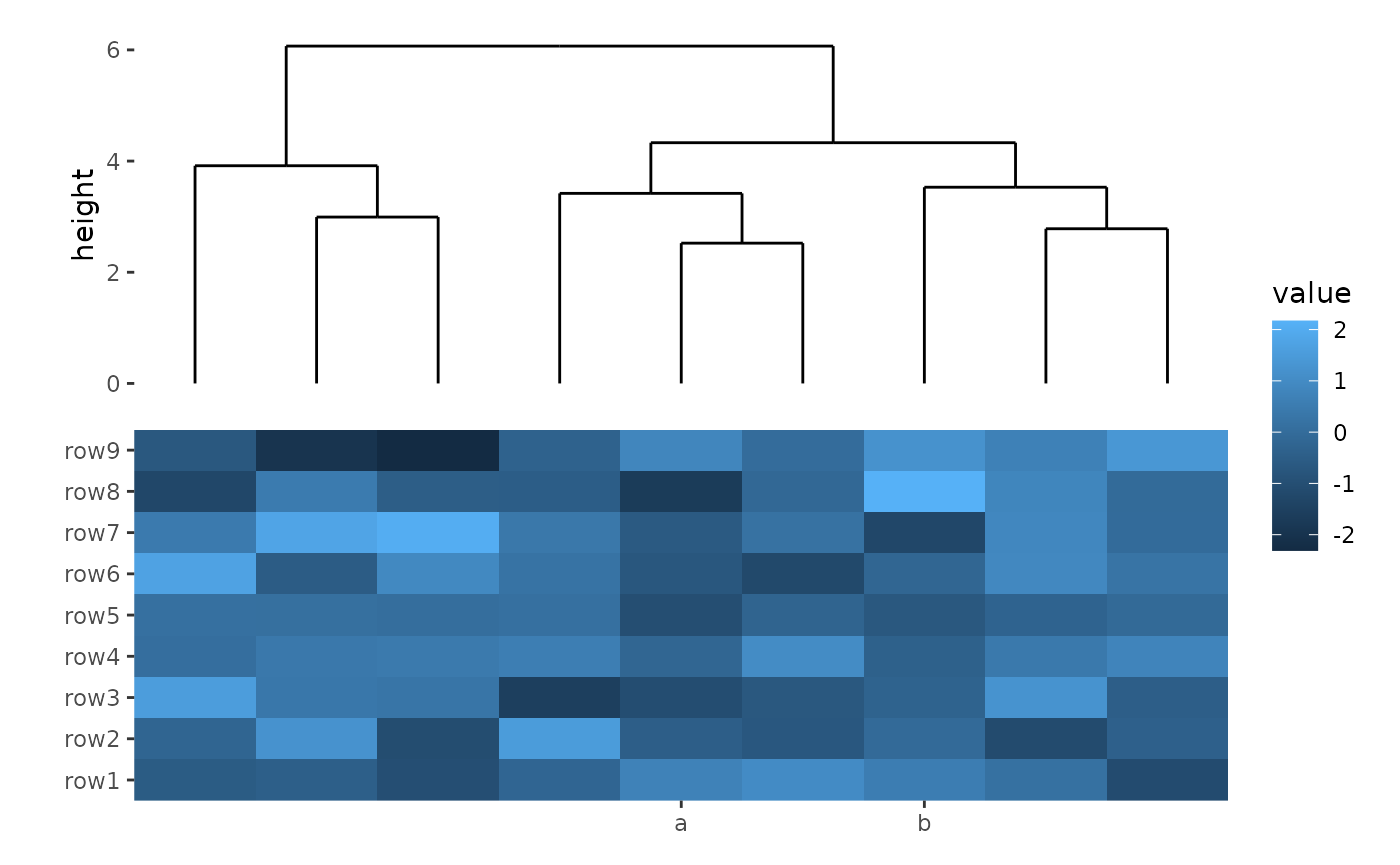
Coords
Currently, only cartesian coordinate can be used to align axis well. Internally, the limits will always be set to the number of observations, with an additional range expansion of 0.5 added on both ends.
Session information
sessionInfo()
#> R version 4.4.1 (2024-06-14)
#> Platform: x86_64-pc-linux-gnu
#> Running under: Ubuntu 22.04.5 LTS
#>
#> Matrix products: default
#> BLAS:   /usr/lib/x86_64-linux-gnu/openblas-pthread/libblas.so.3
#> LAPACK: /usr/lib/x86_64-linux-gnu/openblas-pthread/libopenblasp-r0.3.20.so;  LAPACK version 3.10.0
#>
#> locale:
#>  [1] LC_CTYPE=C.UTF-8       LC_NUMERIC=C           LC_TIME=C.UTF-8
#>  [4] LC_COLLATE=C.UTF-8     LC_MONETARY=C.UTF-8    LC_MESSAGES=C.UTF-8
#>  [7] LC_PAPER=C.UTF-8       LC_NAME=C              LC_ADDRESS=C
#> [10] LC_TELEPHONE=C         LC_MEASUREMENT=C.UTF-8 LC_IDENTIFICATION=C
#>
#> time zone: UTC
#> tzcode source: system (glibc)
#>
#> attached base packages:
#> [1] stats     graphics  grDevices utils     datasets  methods   base
#>
#> other attached packages:
#> [1] ggalign_0.0.4 ggplot2_3.5.1
#>
#> loaded via a namespace (and not attached):
#>  [1] gtable_0.3.5      jsonlite_1.8.9    highr_0.11        dplyr_1.1.4
#>  [5] compiler_4.4.1    tidyselect_1.2.1  jquerylib_0.1.4   systemfonts_1.1.0
#>  [9] scales_1.3.0      textshaping_0.4.0 yaml_2.3.10       fastmap_1.2.0
#> [13] R6_2.5.1          labeling_0.4.3    generics_0.1.3    knitr_1.48
#> [17] tibble_3.2.1      desc_1.4.3        munsell_0.5.1     bslib_0.8.0
#> [21] pillar_1.9.0      rlang_1.1.4       utf8_1.2.4        cachem_1.1.0
#> [25] xfun_0.48         fs_1.6.4          sass_0.4.9        cli_3.6.3
#> [29] pkgdown_2.1.1     withr_3.0.1       magrittr_2.0.3    digest_0.6.37
#> [33] grid_4.4.1        lifecycle_1.0.4   vctrs_0.6.5       evaluate_1.0.0
#> [37] glue_1.8.0        data.table_1.16.0 farver_2.1.2      ragg_1.3.3
#> [41] fansi_1.0.6       colorspace_2.1-1  rmarkdown_2.28    tools_4.4.1
#> [45] pkgconfig_2.0.3   htmltools_0.5.8.1