library(ggalign)
#> Loading required package: ggplot22 General Workflows
The usage of ggalign is simple if you’re familiar with ggplot2 syntax, the typical workflow includes:
- Initialize the layout.
- Customize the layout with:
align_group(): Group observations into panel with a group variable.align_kmeans(): Group observations into panel by kmeans.align_order(): Reorder layout observations based on statistical weights or by manually specifying the observation index.align_order2: Reorder observations using an arbitrary statistical functionalign_hclust(): Reorder or group observations based on hierarchical clustering.
- Adding plots with:
align_dendro(): Add a dendrogram to the plot, and reorder or group observations based on hierarchical clustering.ggalign(): Initialize a ggplot object and align the axes.ggmark(): Add a plot to annotate selected observations.ggcross(): Initialize a ggplot object to connect two different layout crosswiseggfree(): Initialize a ggplot object without aligning the axes.
- Layer additional
ggplot2elements such as geoms, stats, or scales.

Let’s create a sample matrix:
set.seed(123)
small_mat <- matrix(rnorm(56), nrow = 7)
rownames(small_mat) <- paste0("row", seq_len(nrow(small_mat)))
colnames(small_mat) <- paste0("column", seq_len(ncol(small_mat)))
Each *_layout() function accepts default data, inherited by all plots in the layout.
Here’s a simple example:
stack_discretev(small_mat) +
align_dendro() +
theme(axis.text.x = element_text())- 1
- We initialize a vertical stack.
- 2
- Reorder the observations based on hierarchical clustering and add a dendrogram tree.
- 3
- Add x-axis text.
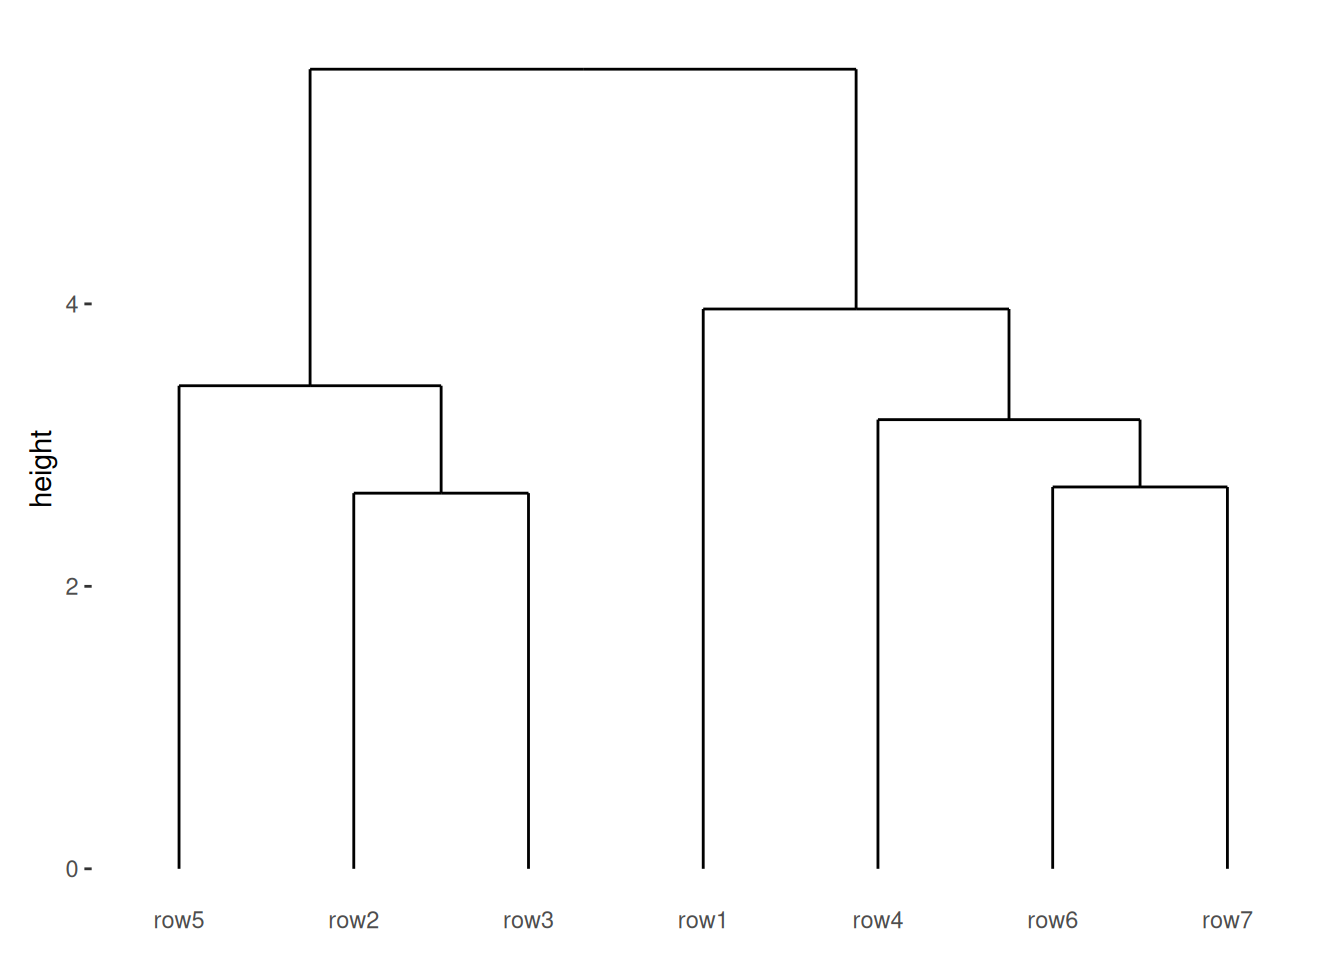
This function produces a simple dendrogram. The stack_discretev() function initializes a vertical stack and aligns discrete variables. It is simply an alias for stack_discrete("v"). By default, the axis text on the axis used for alignment is removed. This is because it’s often unclear which plot should display the axis text, as typically, we want it to appear in only one plot. However, you can easily use the theme() function to control where the axis text appears.
Internally, align_dendro() will reorder the observations based on the dendrogram, and other plots in the layout will follow this ordering.
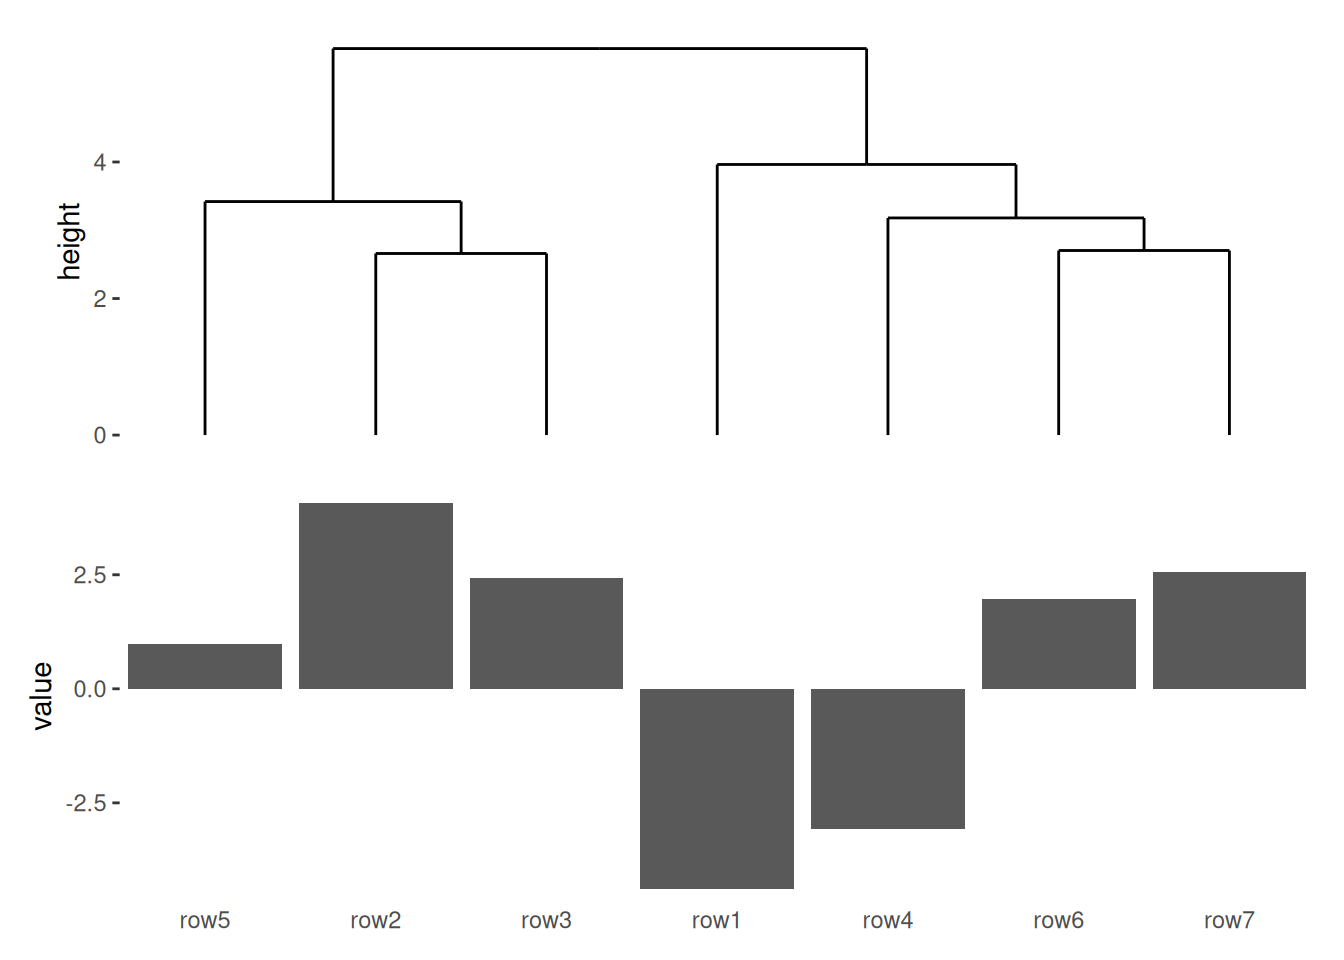
stack_discretev(small_mat) +
align_dendro() +
ggalign(data = rowSums) +
geom_bar(aes(.discrete_x, value), stat = "identity") +
theme(axis.text.x = element_text())- 1
- We initialize a vertical stack.
- 2
- Reorder the observations based on hierarchical clustering and add a dendrogram tree.
- 3
- Create a new ggplot in the layout, and use data based on the sum of the layout data.
- 4
- Add a bar layer.
- 5
- Add x-axis text.
The data in the underlying ggplot object of ggalign() function contains following columns (more details will be introduced in the Section 6.1):
.panel: the group panel for the aligned axis. It meansx-axisfor vertical stack layout,y-axisfor horizontal stack layout..x/.yand.discrete_x/.discrete_y: an integer index ofx/ycoordinates and a factor of the data labels (only applicable when names exists)..namesand.index: A character names (only applicable when names exists) and an integer of index of the original data.value: the actual value (only applicable ifdatais amatrixor atomic vector).
It is recommended to use
.x/.y, or.discrete_x/.discrete_yas thex/ymapping.
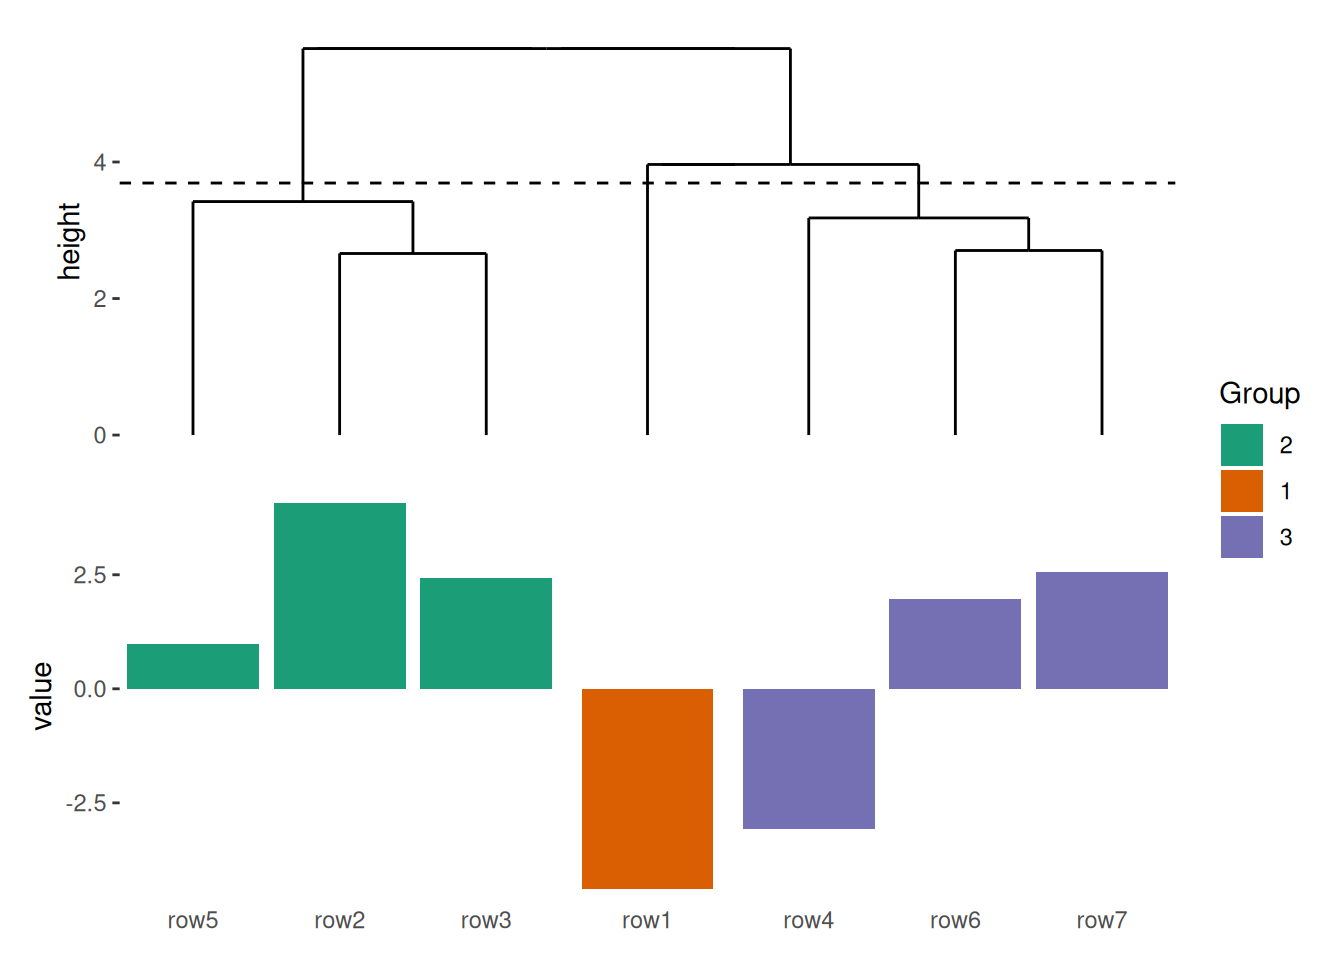
align_dendro() can also split the observations into groups.
stack_alignv(small_mat) +
align_dendro(k = 3) +
ggalign(data = rowSums) +
geom_bar(aes(.discrete_x, value, fill = .panel), stat = "identity") +
scale_fill_brewer(palette = "Dark2", name = "Group") +
theme(axis.text.x = element_text())- 1
- We initialize a vertical stack.
- 2
- Reorder and group the observations based on hierarchical clustering, and add a dendrogram tree.
- 3
- Create a new ggplot in the layout, and use data based on the sum of the layout data.
- 4
- Add a bar layer.
- 5
- Set fill scale palette.
- 6
- Add x-axis text.
One common visualization associated with the dendrogram is the heatmap. You can use ggheatmap() to initialize a heatmap layout. When grouping the observations using align_dendro(k = 3), a special column named branch is added, which you can use to color the dendrogram tree.
ggheatmap(small_mat) +
theme(axis.text.x = element_text(angle = -60, hjust = 0)) +
anno_left() +
align_dendro(aes(color = branch), k = 3) +
scale_fill_brewer(palette = "Dark2")
#> → heatmap built with `geom_tile()`- 1
- We initialize a heatmap layout.
- 2
- adjust the x-axis label theme element.
- 3
- we initialize an annotation in the left side of the heatmap body, and set it as the active context, in this way, all following addition will be directed to the left annotation.
- 4
-
Reorder and group the observations based on hierarchical clustering, and add a dendrogram tree, coloring the tree by
branch. - 5
- Set fill scale palette.
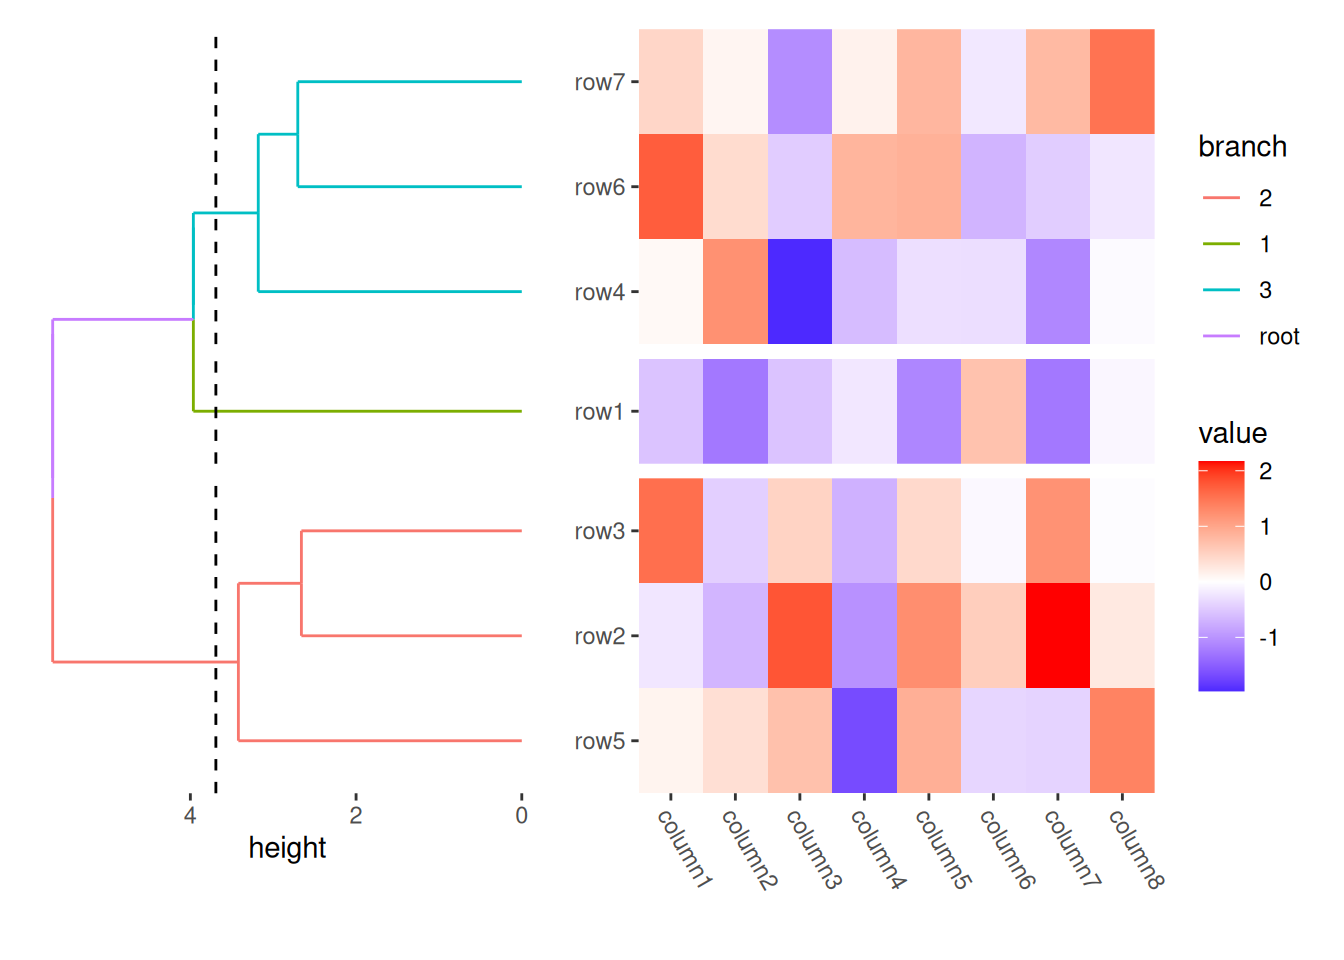
ggheatmap() will automatically add axis text in the heatmap body, so you don’t need to manually adjust axis text visibility using theme(axis.text.x = element_text())/theme(axis.text.y = element_text()).
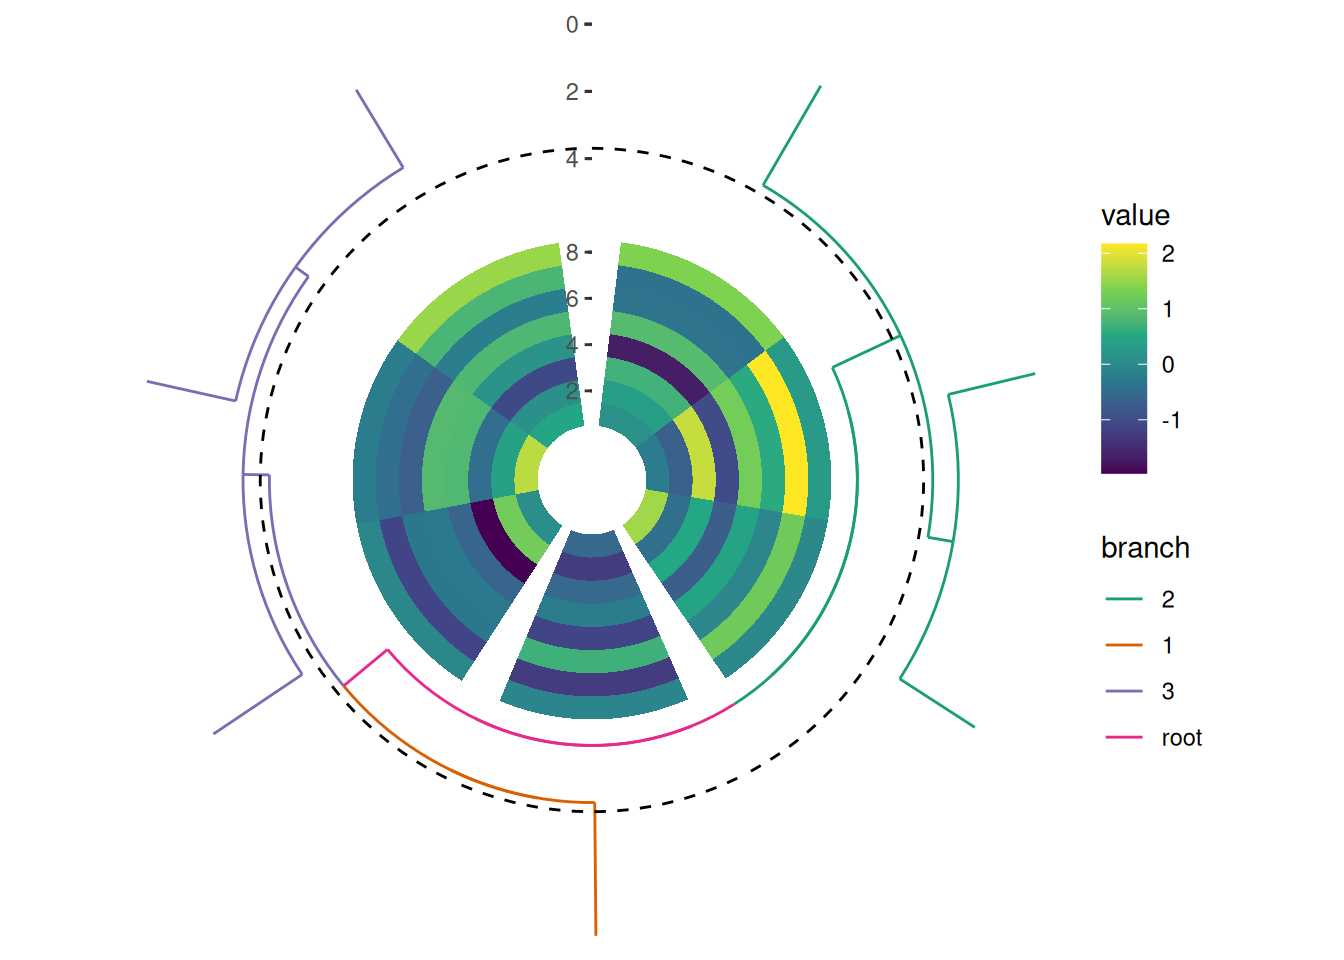
We can also arrange the dendrogram in a circular layout to visualize hierarchical relationships in a more compact and aesthetically pleasing way.
circle_discrete(small_mat, radial = coord_radial(inner.radius = 0.1)) +
ggalign() +
geom_tile(aes(y = .column_index, fill = value)) +
scale_fill_viridis_c() +
align_dendro(aes(color = branch), k = 3L) +
scale_color_brewer(palette = "Dark2")- 1
- We initialize a circle layout and set the inner radius.
- 2
- Create a new ggplot in the layout, and use data the same with the layout data.
- 3
-
Add a tile layer, the matrix input will be converted into a long formated data frame with column
.column_indexindicates the column index of the original matrix. - 4
- Set fill scale palette.
- 5
-
Reorder and group the observations based on hierarchical clustering, and add a dendrogram tree, coloring the tree by
branch. - 6
- Set color scale palette.
Having explored the core principles of ggalign, you should now be familiar with its basic workflow. In the next chapter, we’ll introduce the StackLayout, a powerful tool for arranging multiple plots in a stacked fashion—either horizontally or vertically—while maintaining full control over their alignment. We’ll explore how StackLayout and its various functions can give you even greater flexibility in creating sophisticated layouts.