library(ggalign)#> Loading required package: ggplot2#> ========================================#> ggalign version 1.2.0.9000#> #> If you use it in published research, please cite: #> Peng, Y.; Jiang, S.; Song, Y.; et al. ggalign: Bridging the Grammar of Graphics and Biological Multilayered Complexity. Advanced Science. 2025. doi:10.1002/advs.202507799#> ========================================set.seed(123)small_mat<-matrix(rnorm(56), nrow =7)rownames(small_mat)<-paste0("row", seq_len(nrow(small_mat)))colnames(small_mat)<-paste0("column", seq_len(ncol(small_mat)))
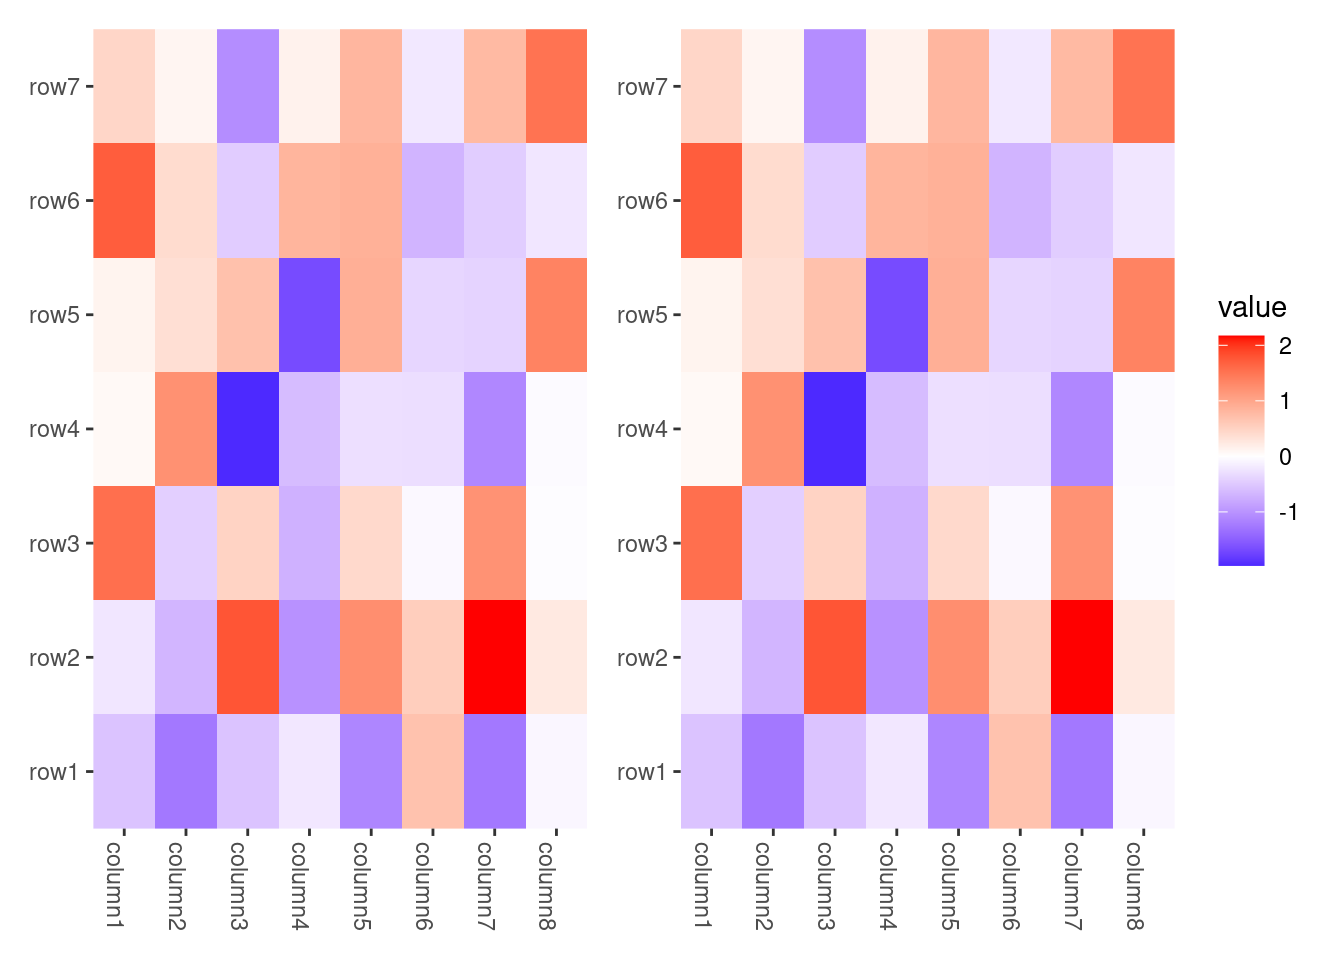
The data of ggheatmap()/quad_layout() can inherit from the parent stack_layout(), but the data format must match. Otherwise, you will need to manually provide the data.
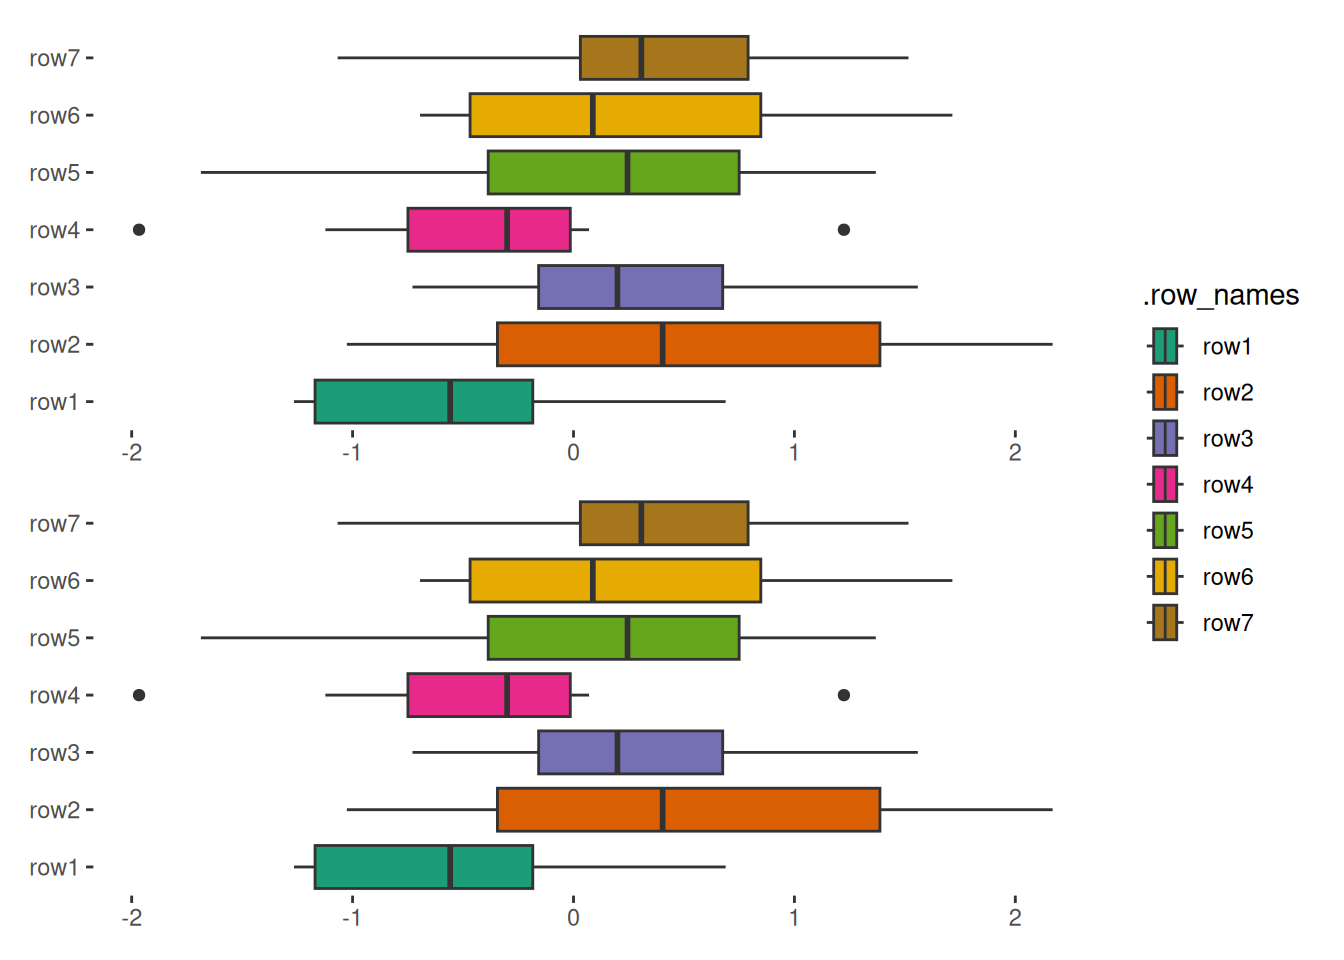
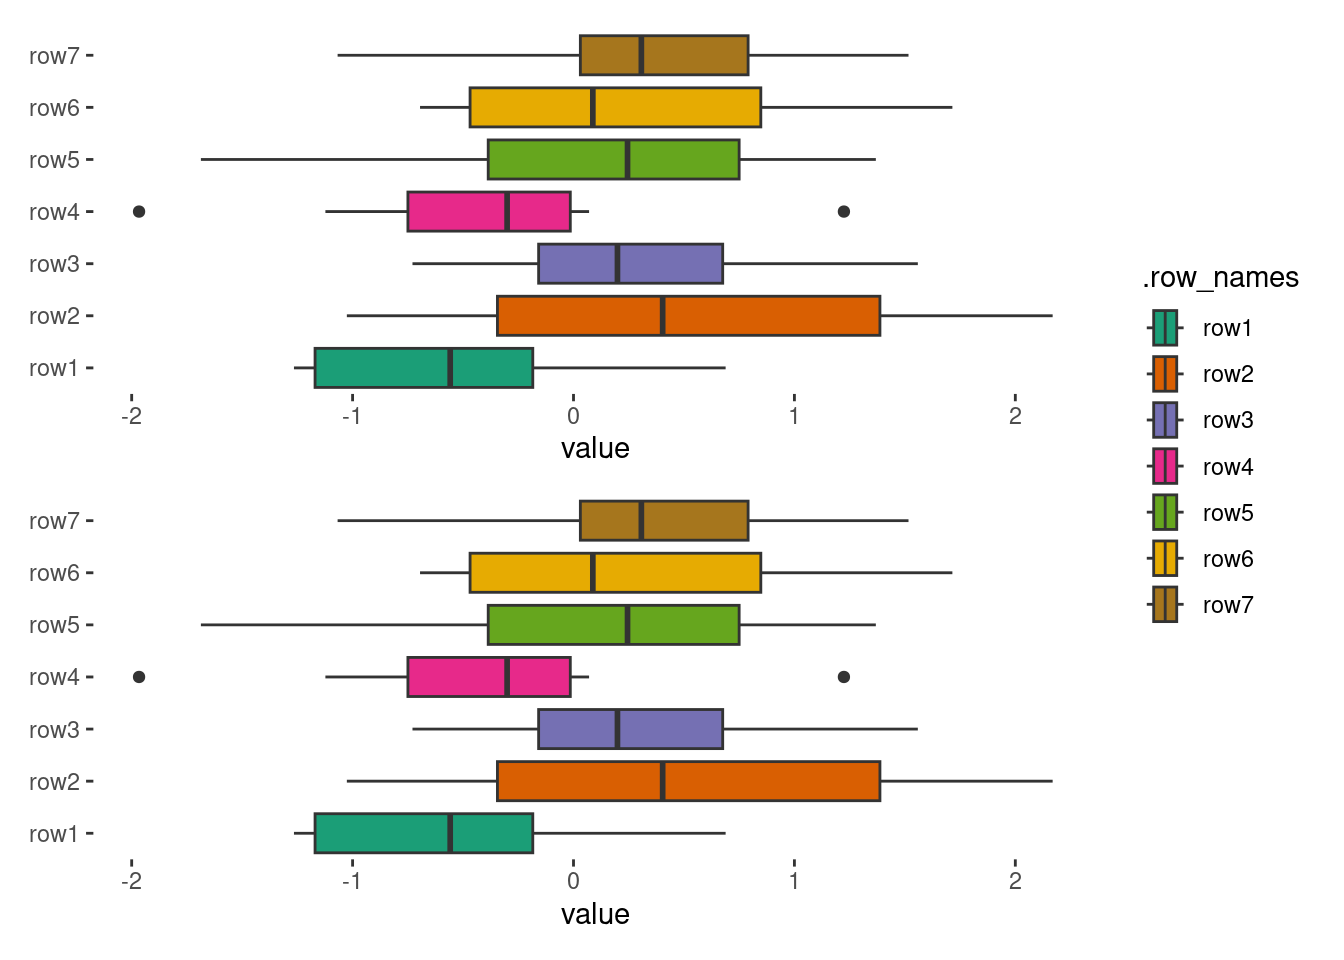
quad_continuousv_plot<-quad_layout(small_mat, xlim =NULL)+geom_boxplot(aes(value, .discrete_y, fill =.row_names))+scale_fill_brewer(palette ="Dark2")# Note: `stack_continuousv()` requires a data frame# but `quad_layout(xlim = NULL)` requires a matrixstack_continuousv()+quad_continuousv_plot+quad_continuousv_plot
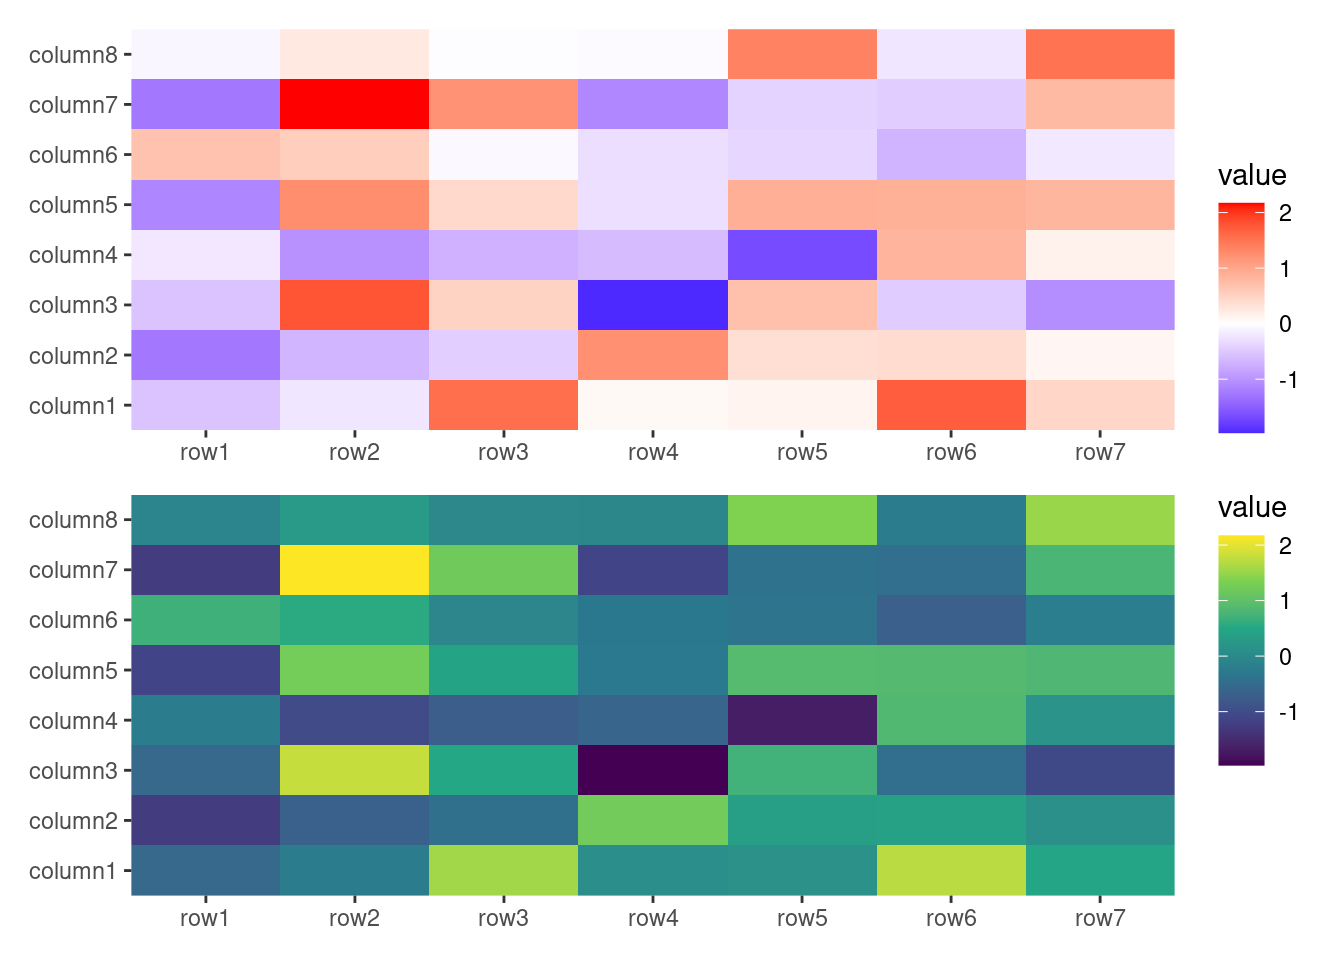
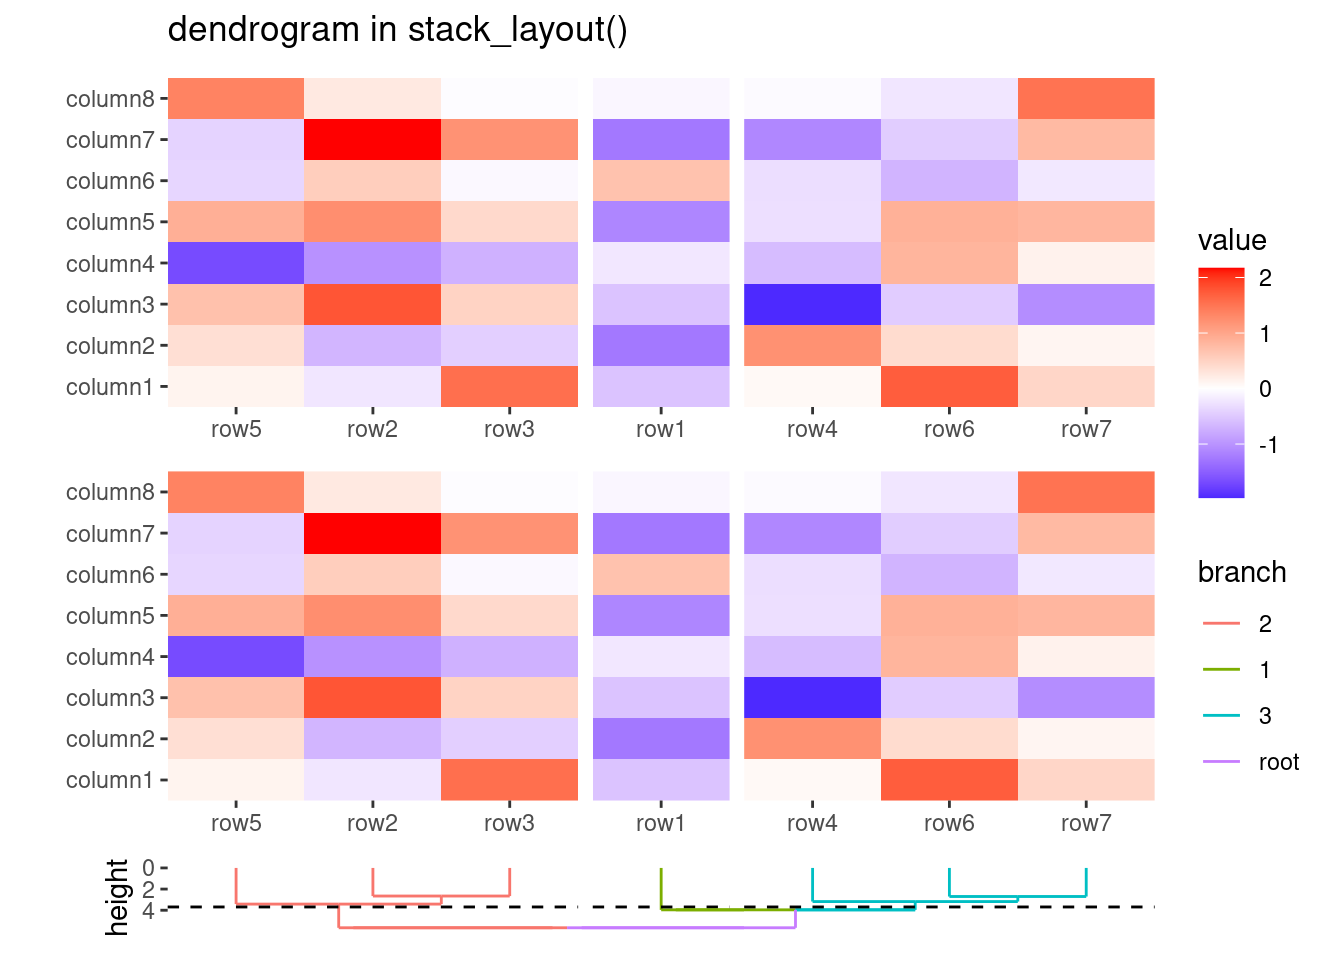
When adding ggheatmap()/quad_layout() to a vertical stack_layout(), the inherited matrix is automatically transposed. This ensures the columns of the nested plot align with the observations of the stack.
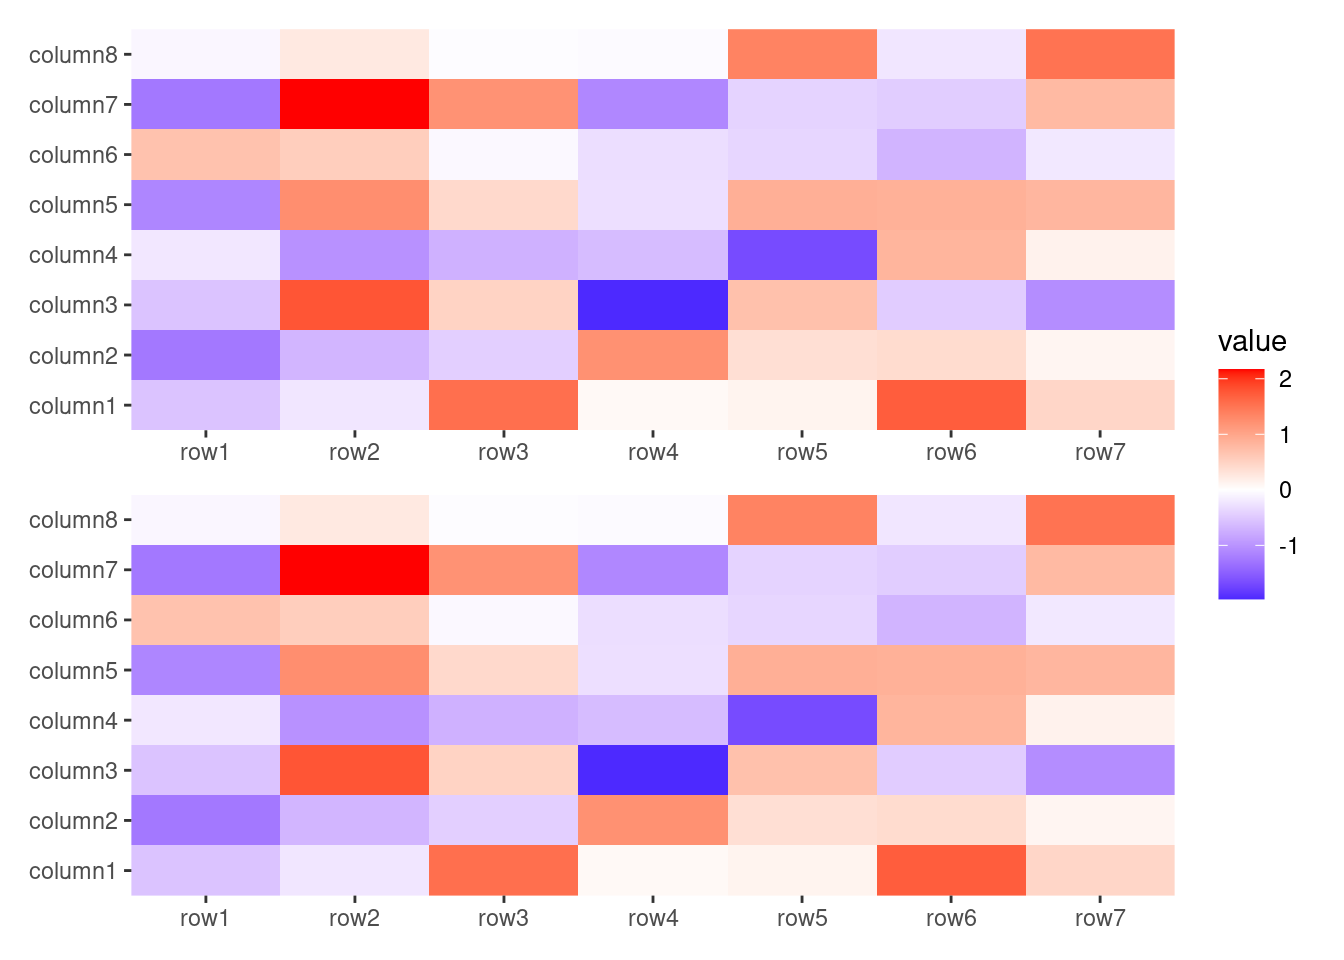
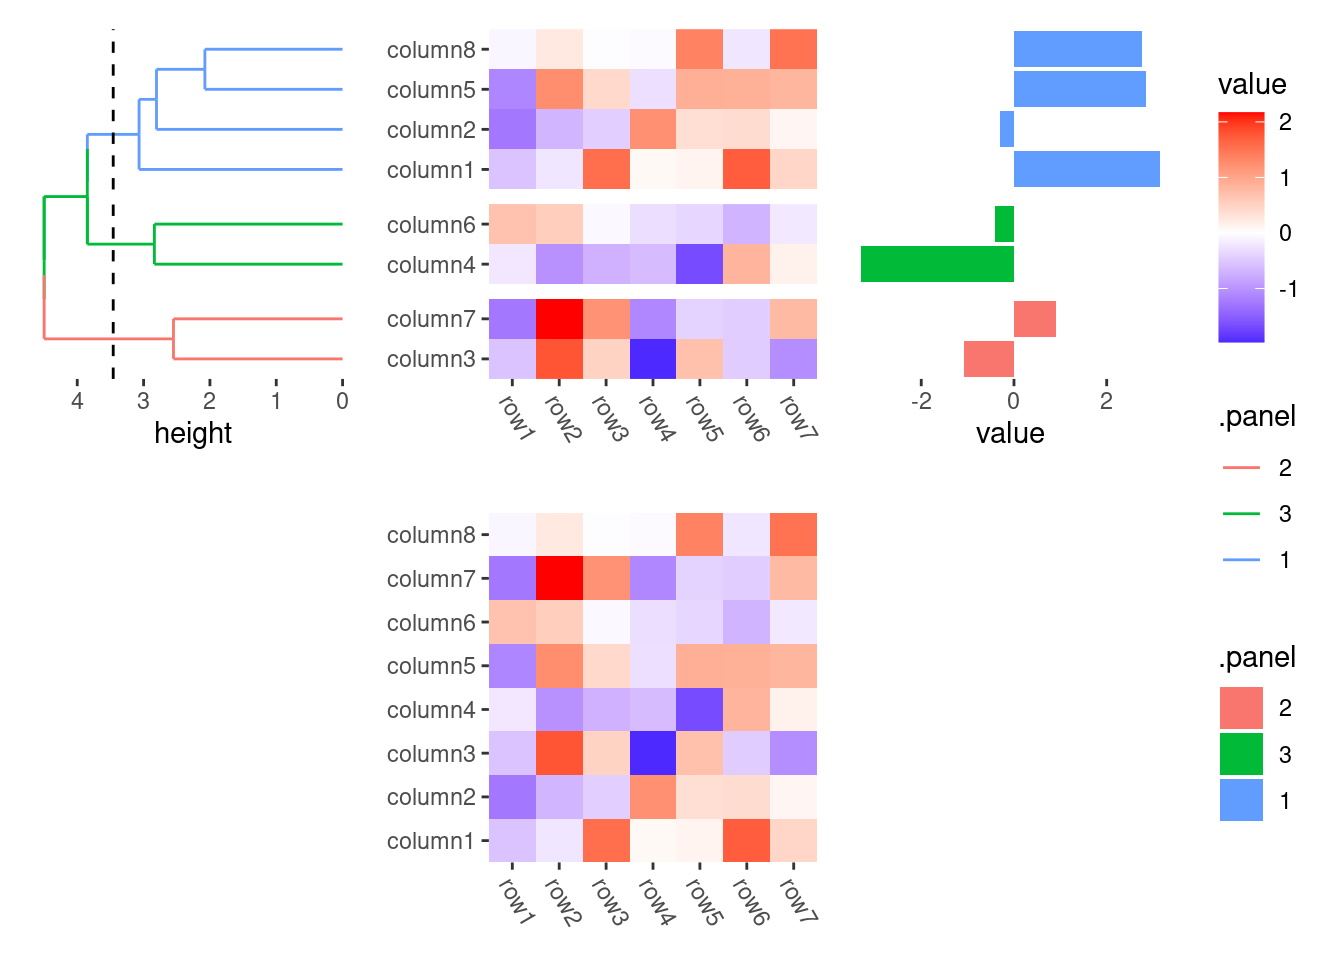
A numeric or a unit object of length 3 should be provided in stack_discrete()/stack_continuous() when placing a quad_layout(). For vertical stack_layout(), this means quad_layout() with left or right annotations; for horizontal stack_layout(), this means quad_layout() with top or bottom annotations. The first size controls the relative width/height of the left or top annotation, the second controls the relative width/height of the main plot, and the third controls the relative width/height of the right or bottom annotation.
By default the three rows/columns will have equal sizes.
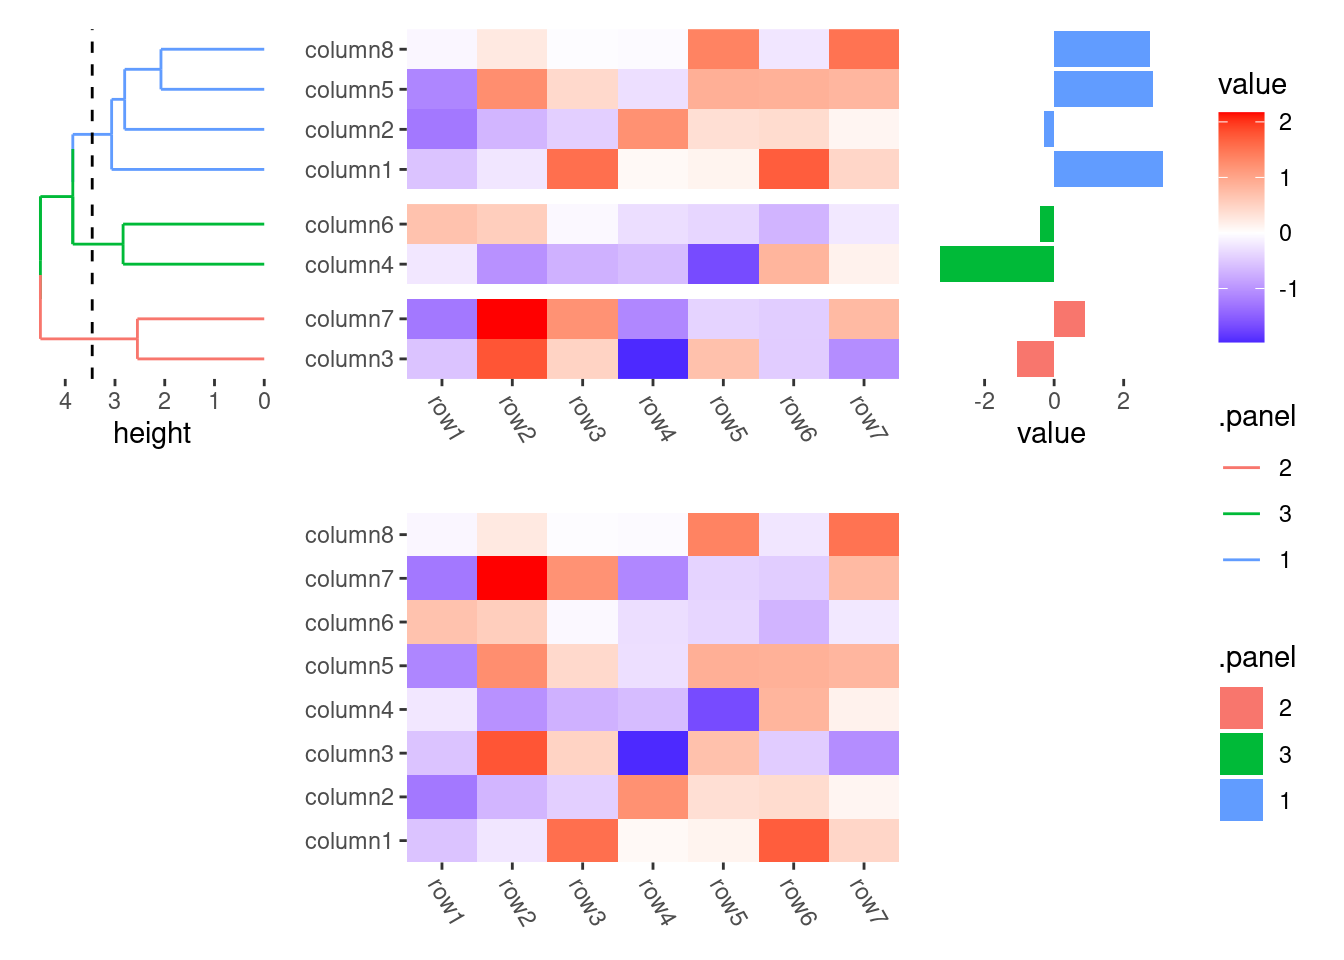
In these cases, specifying width/height within quad_active(), quad_layout(), or ggheatmap() will not affect the size, as the stack layout size settings take precedence:
Now that we have covered all the Layout usage in the package, we will build upon these concepts to explore more advanced strategies for integrating elements across multiple plots and annotations within a layout.