5 Overview
ggalign simplifies data-aware alignment in ggplot2, handling common tasks such as sorting, grouping, or clustering observations before composition. It introduces the concept of observation alignment, which ensures that identical data points maintain consistent positions across multiple interconnected plots.
5.1 Layout System
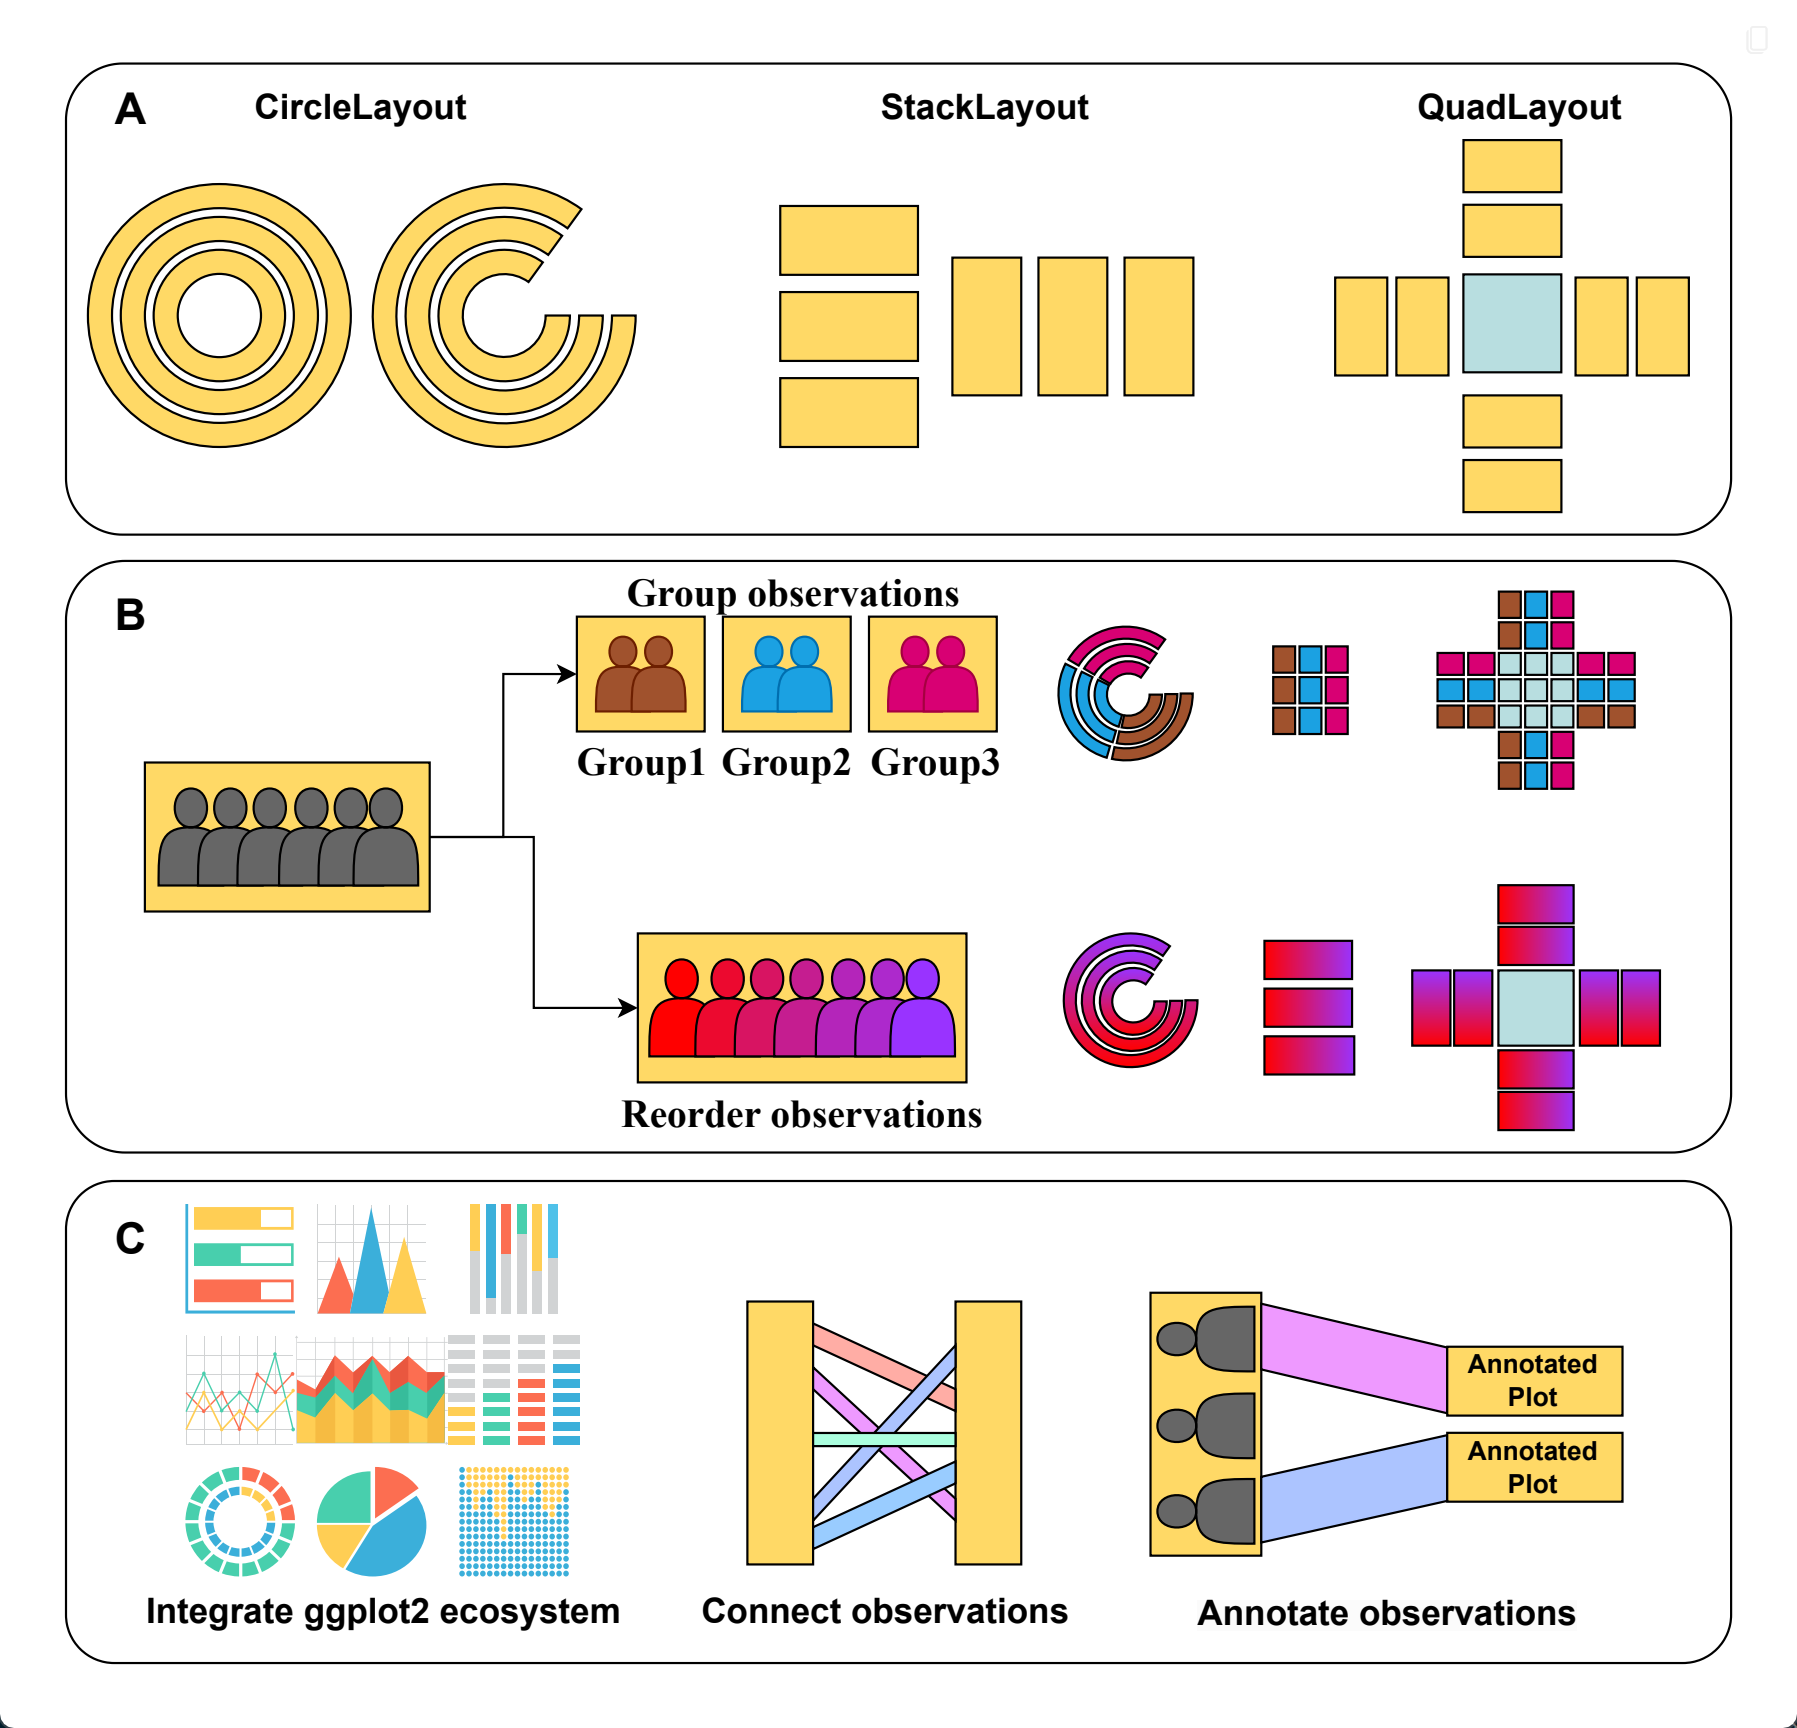
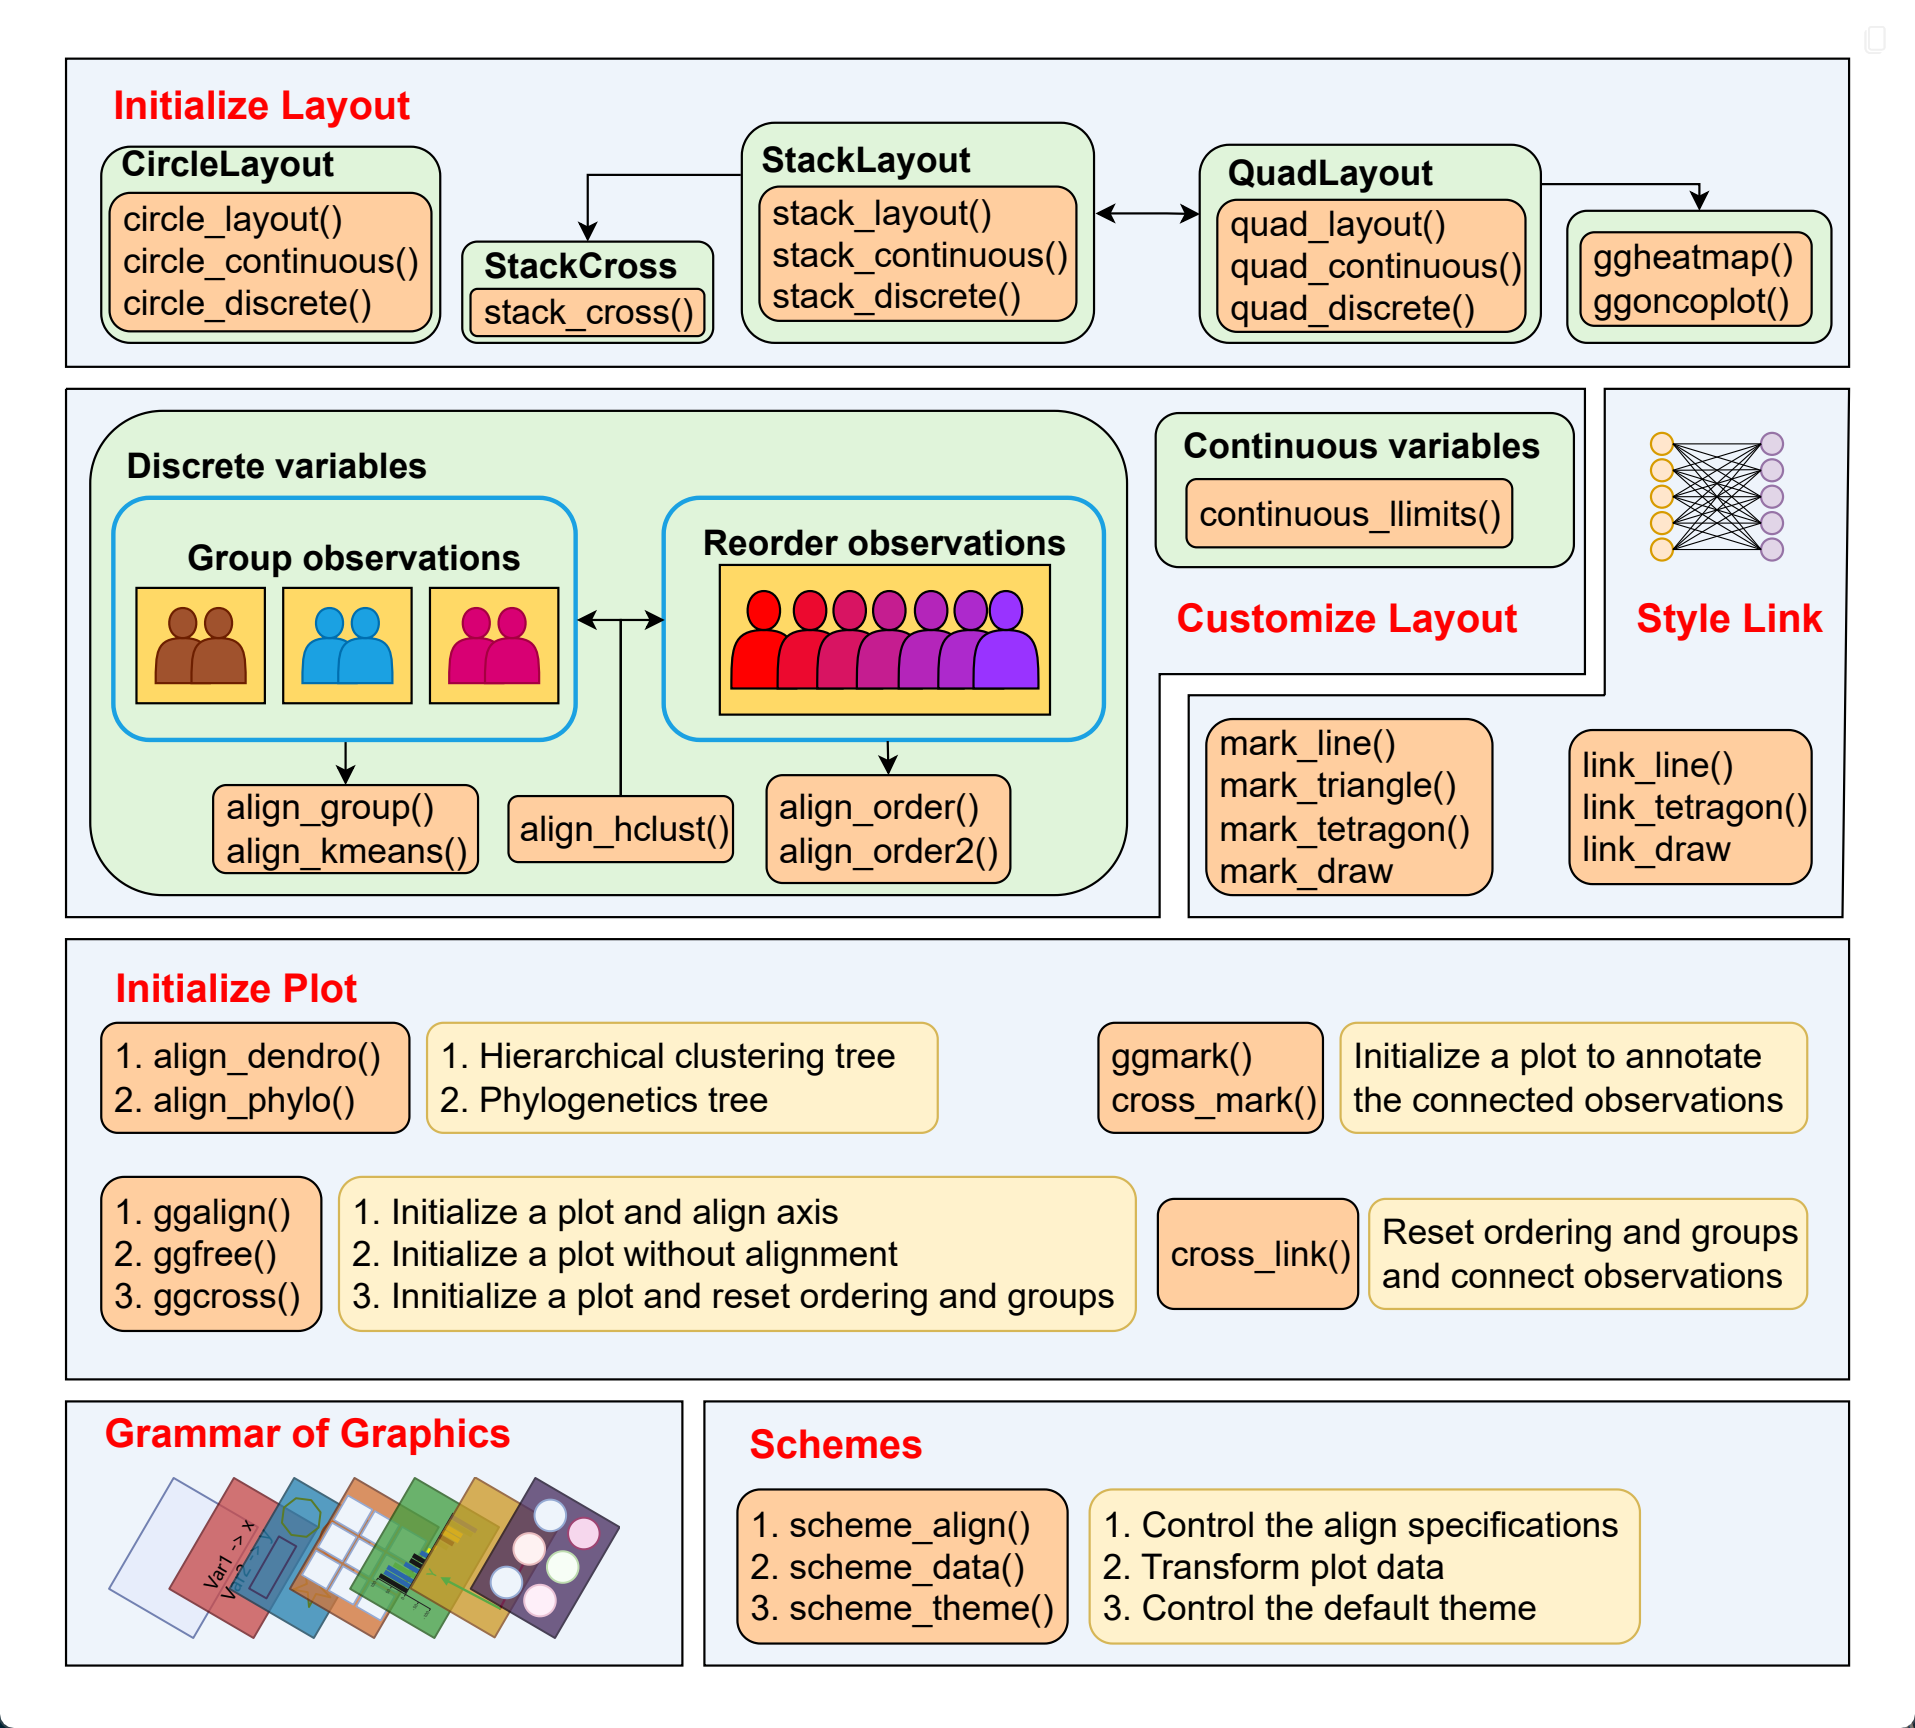
At the heart of ggalign data-aware composition is an object-oriented Layout system that integrates seamlessly with ggplot2. It provides three core layout types:
StackLayout: Stacks plots horizontally or vertically.QuadLayout: Arranges plots in four quadrants (top, left, bottom, right) around a central plot.CircleLayout: Positions plots in a circular pattern.
Each layout supports both discrete (e.g., categories) and continuous (e.g., numerical) data, and includes specialized alignment functions:
For StackLayout:
stack_discrete(): Align discrete variable along the stack.stack_continuous(): Align continuous variable along the stack.stack_layout(): A unified interface that handles both discrete and continuous data.
For QuadLayout:
quad_continuous()/ggside(): Align continuous variables in both horizontal and vertical directions.quad_discrete(): Align discrete variables in both horizontal and vertical directions.quad_layout(): A general function that adapts to both data types and directions.
For CircleLayout:
circle_discrete(): Align discrete variable in the circle.circle_continuous(): Align continuous variable in the circle.circle_layout(): A unified interface for both cases.
5.2 Overview of Supporting Systems
In addition to the core Layout system, ggalign provides several helper systems that enhance data-aware composition by managing how observations are grouped, ordered, and supplemented with additional plot elements. These systems work together with layouts to create flexible and insightful multi-plot arrangements:
- Layout customization:
align_group(): Group observations into panel with a group variable.align_kmeans(): Group observations into panel by kmeans.align_order(): Reorder layout observations based on statistical weights or by manually specifying the observation index.align_order2: Reorder observations using an arbitrary statistical functionalign_hclust(): Reorder or group observations based on hierarchical clustering.
- Plot adding:
align_dendro(): Add a dendrogram to the plot, and reorder or group observations based on hierarchical clustering.ggalign(): Initialize a ggplot object and align the axes.ggmark(): Add a plot to annotate selected observations.ggcross(): Initialize a ggplot object to connect two different layout crosswiseggfree(): Initialize a ggplot object without aligning the axes.
5.3 Input data
Before exploring data-aware compostion, it’s important to understand how axis alignment works in ggplot2.
For continuous axes, alignment is straightforward: simply ensure the axis limits are consistent across plots.
For discrete axes, alignment is more challenging. You must have the same set of unique values and maintain a consistent ordering across all plots. In ggplot2, this can be difficult when working with long-format data frames because the factor levels or ordering may differ.
ggalign addresses this challenge by using matrix inputs for layouts that align discrete axes (e.g., the *_discrete() functions). In this approach:
Each row of the matrix represents a unique discrete value (called an “observation”).
The total number of rows defines the complete set of unique discrete values.
Reordering rows in the matrix controls the ordering of observations consistently across all linked plots.
This design is especially useful for layouts that align axes in both directions (horizontal and vertical), such as heatmap, since matrices can be easily transposed to switch row and column alignment.
The matrix is only used for positioning. Before rendering, ggalign will reorder the matrix rows based on the layout, and automatically converts it into a long-format data frame — the standard input for ggplot2.
The main difference between discrete and continuous variable alignment in ggalign lies in the input data:
Discrete variables require a matrix as input.
Continuous variables require a data frame, just like in standard ggplot2.
When a data frame is required, the input will be automatically converted using fortify_data_frame() if needed. When a matrix is required, the input will be automatically converted using fortify_matrix().
By default, fortify_data_frame() calls ggplot2::fortify() for conversion.
Note: When applied to a matrix,
fortify_data_frame()will convert it into a long-formatted data frame, which differs from the behavior ofggplot2::fortify().