The ggalign package provides six free_ functions that give you precise control over plot alignment behavior by selectively disabling alignment constraints for specific plot elements in align_plots().
free_align() - Disables panel alignment for specified axes.
free_space() - Removes space constraints when aligning.
free_border() - Attaches border elements (like axis titles) to the panel but keeps their size.
library(ggalign)#> Loading required package: ggplot2#> ========================================#> ggalign version 1.2.0.9000#> #> If you use it in published research, please cite: #> Peng, Y.; Jiang, S.; Song, Y.; et al. ggalign: Bridging the Grammar of Graphics and Biological Multilayered Complexity. Advanced Science. 2025. doi:10.1002/advs.202507799#> ========================================
4.1 Position String Notation
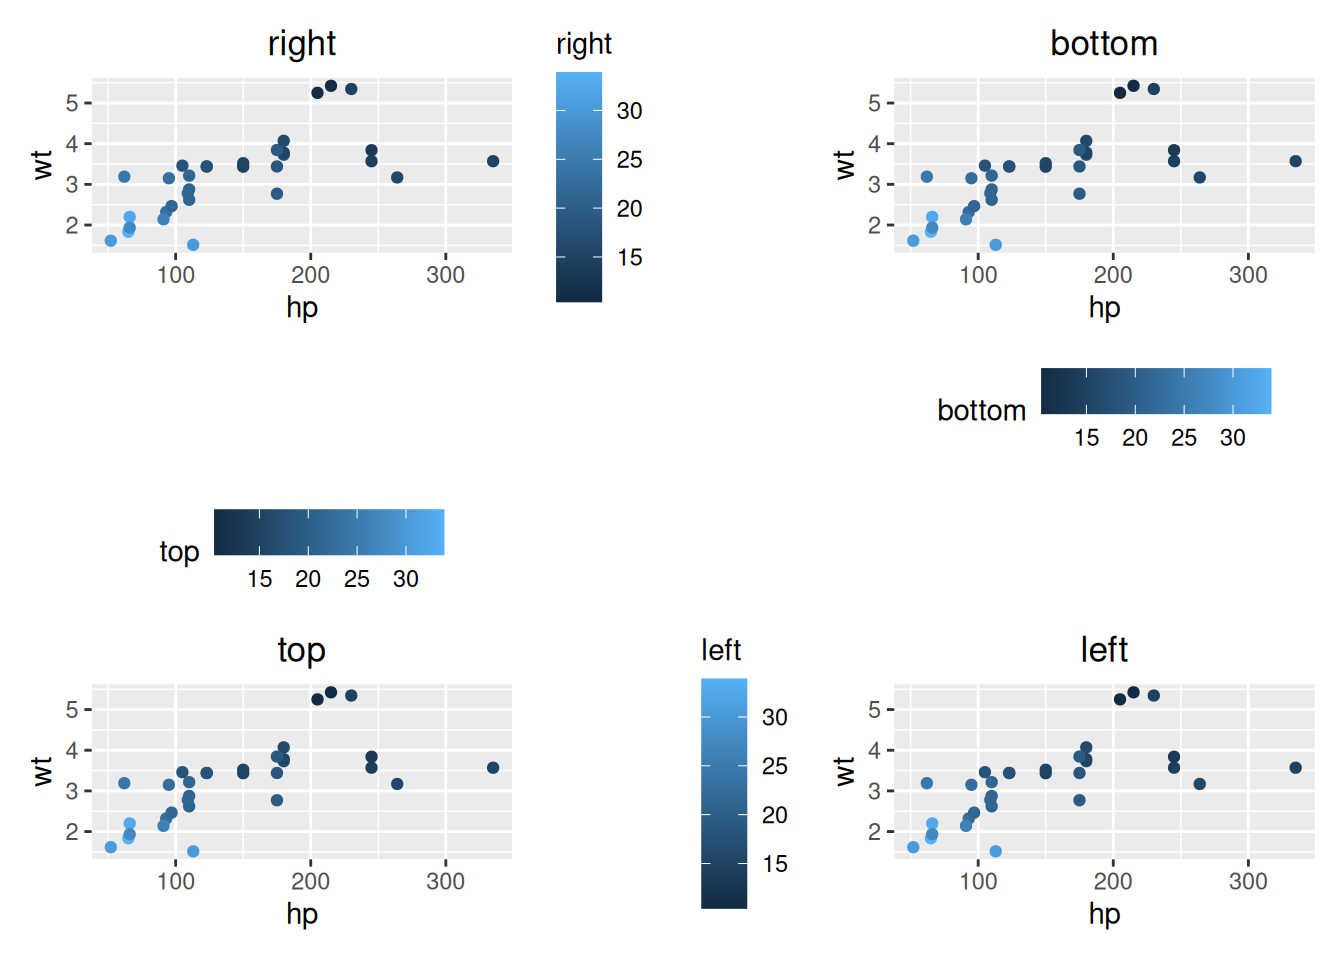
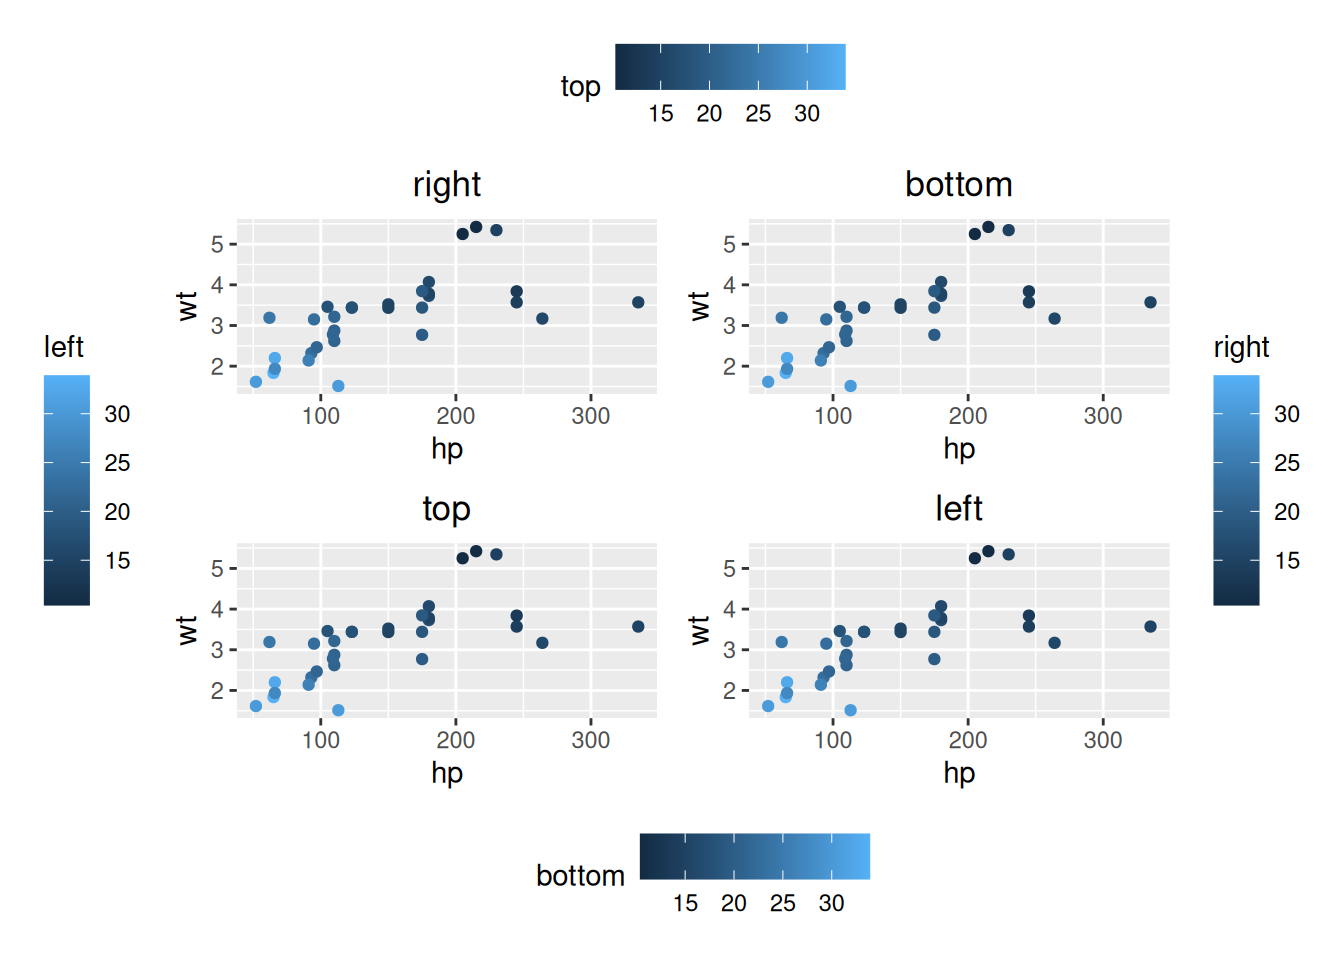
Most free_ functions use a consistent "tlbr" notation system where each letter represents a side of the plot:
t: top
l: left
b: bottom
r: right
First, let’s create some example plots:
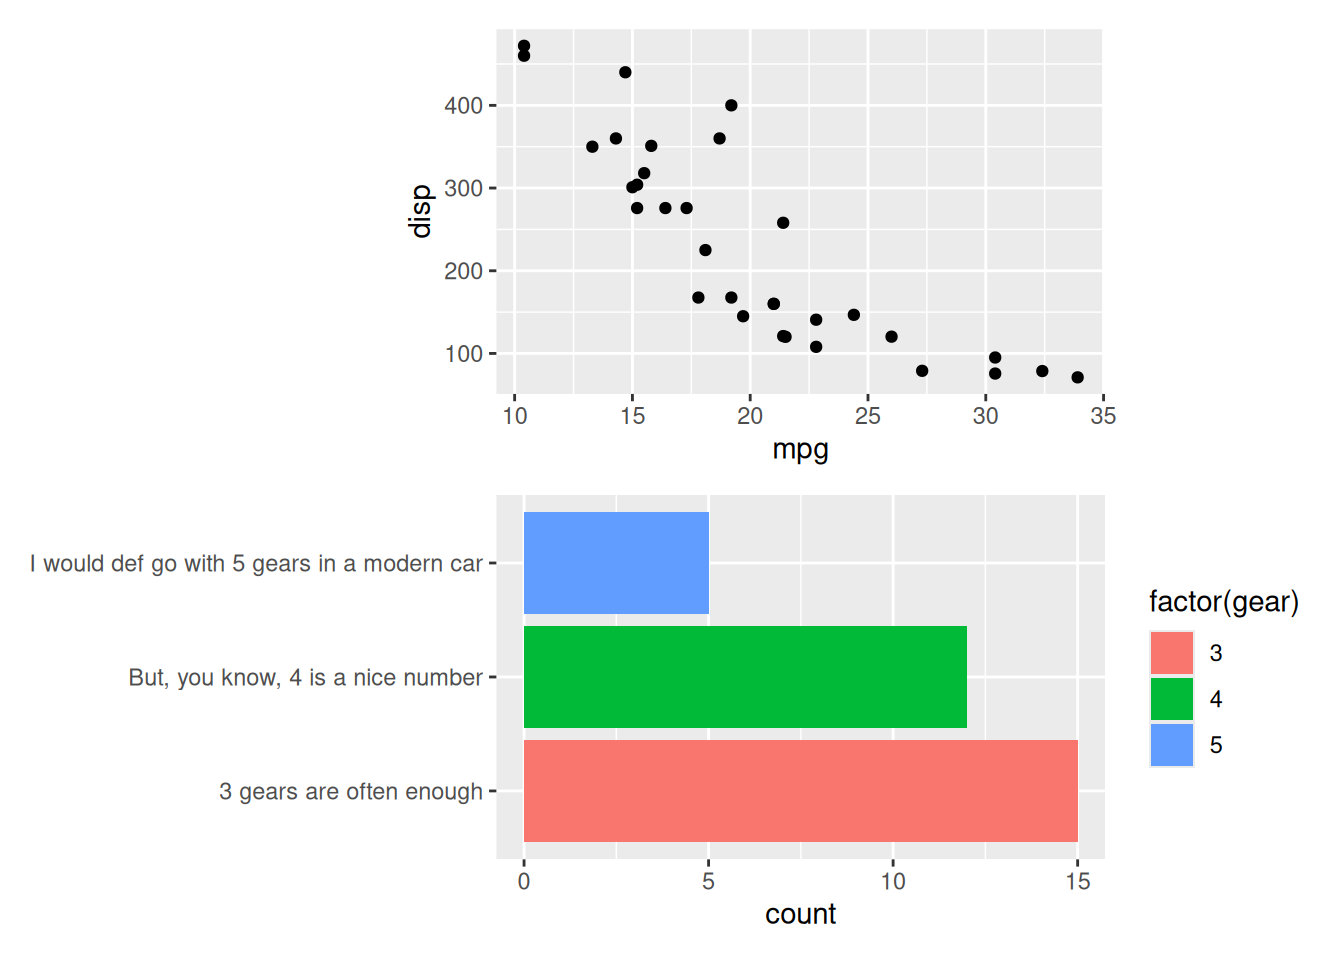
# A simple scatter plotp_simple<-ggplot(mtcars)+geom_point(aes(mpg, disp))# Create a plot with long axis labels that causes alignment issuesp_wide_labels<-ggplot(mtcars)+geom_bar(aes(y =factor(gear), fill =factor(gear)))+scale_y_discrete( name =NULL, labels =c("3 gears are often enough","But, you know, 4 is a nice number","I would def go with 5 gears in a modern car"))
4.2free_align()
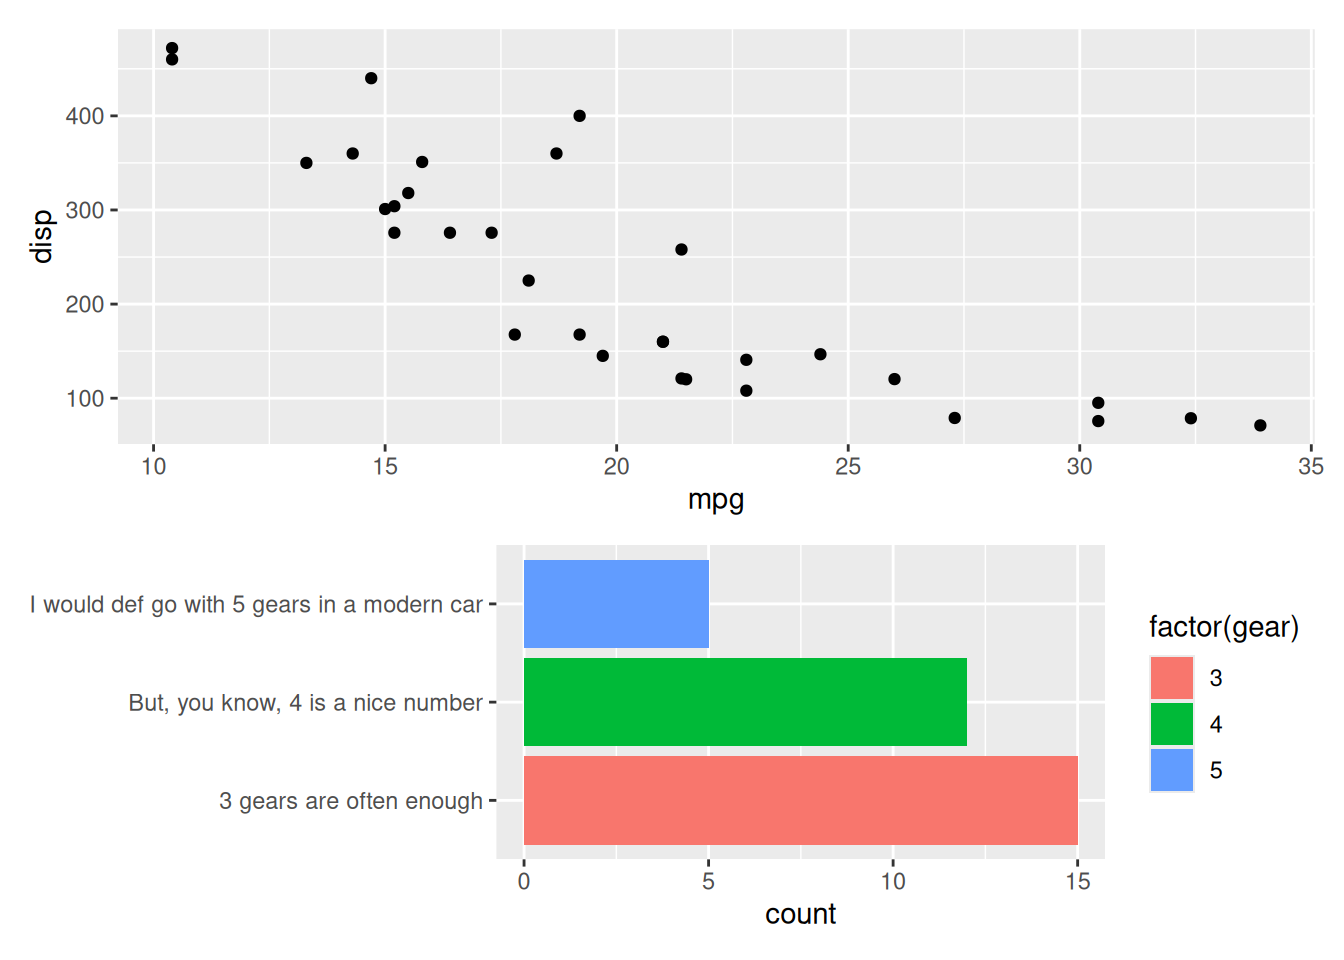
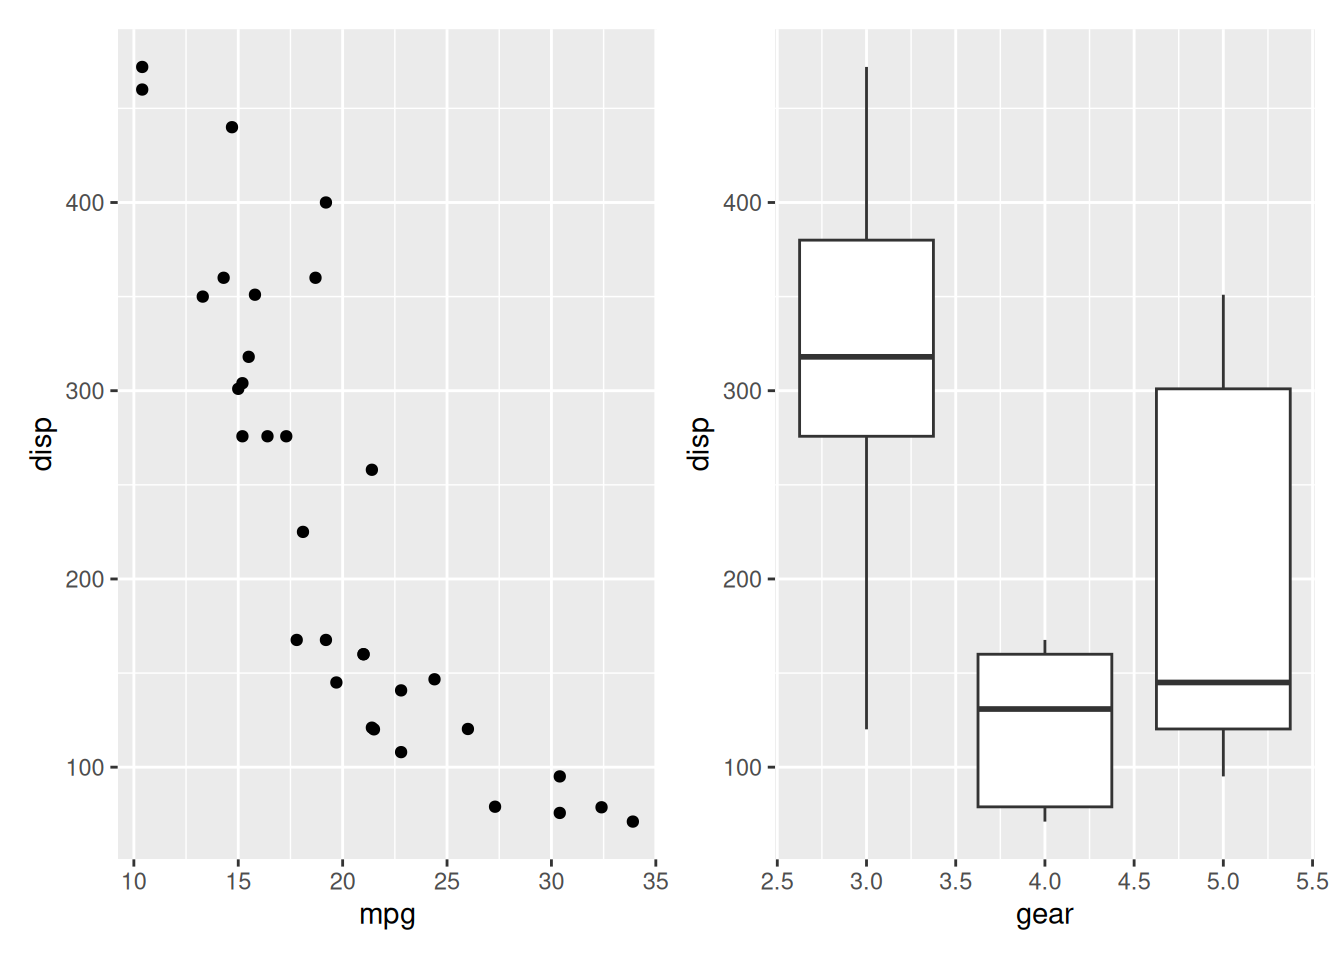
By default, align_plots() aligns plot panels so axes match. This can cause excessive spacing when plots differ in axis label lengths. free_align() disables panel alignment on specified sides.
# Problem: When combined, it looks bad due to forced alignmentalign_plots(p_simple, p_wide_labels, ncol =1L)
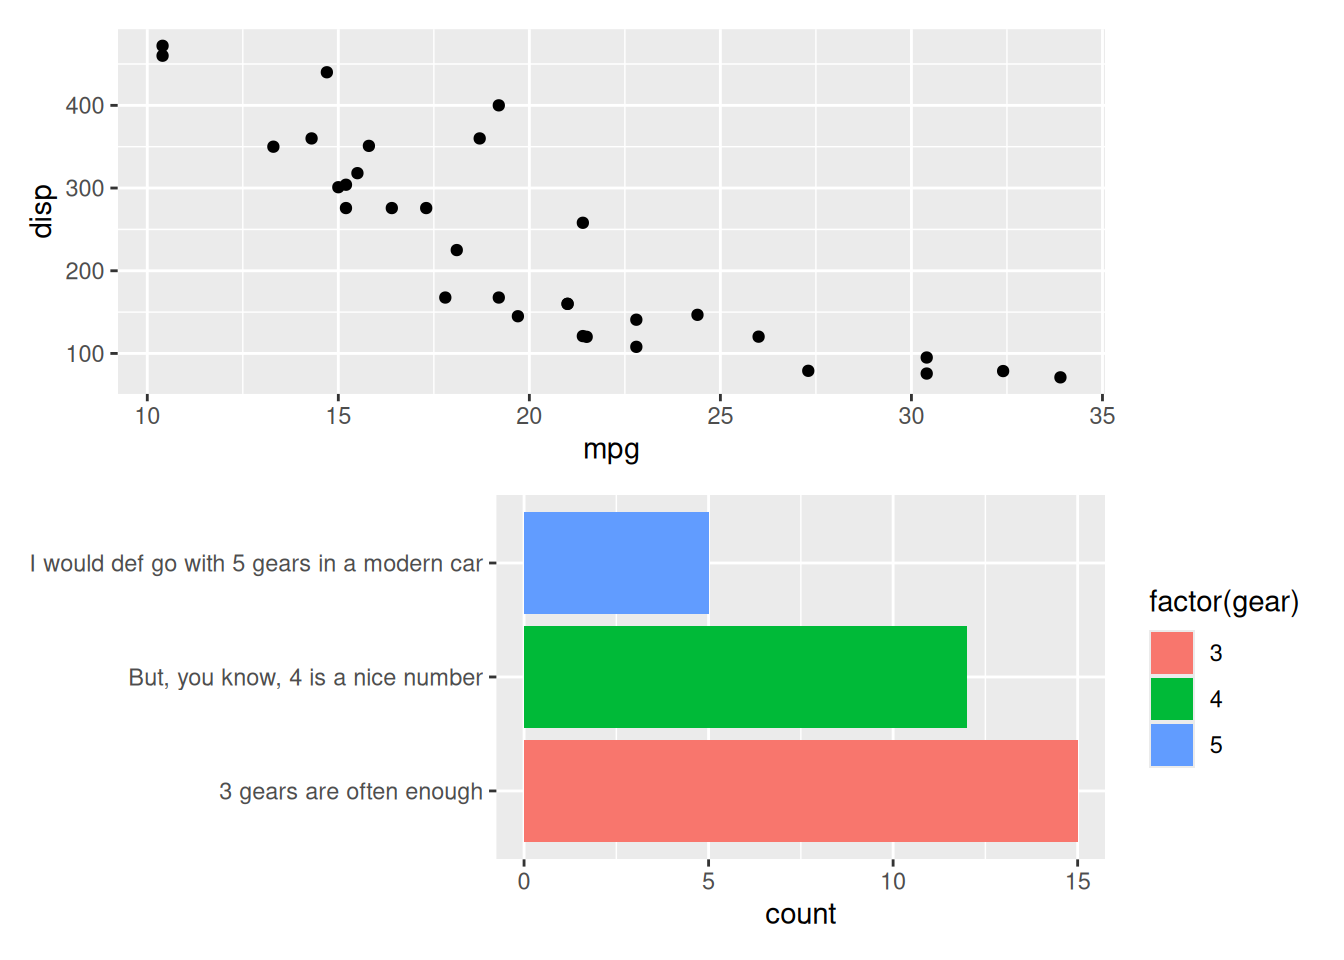
# Solution: Use free_align to prevent panel alignmentalign_plots(p_simple, free_align(p_wide_labels), ncol =1L)
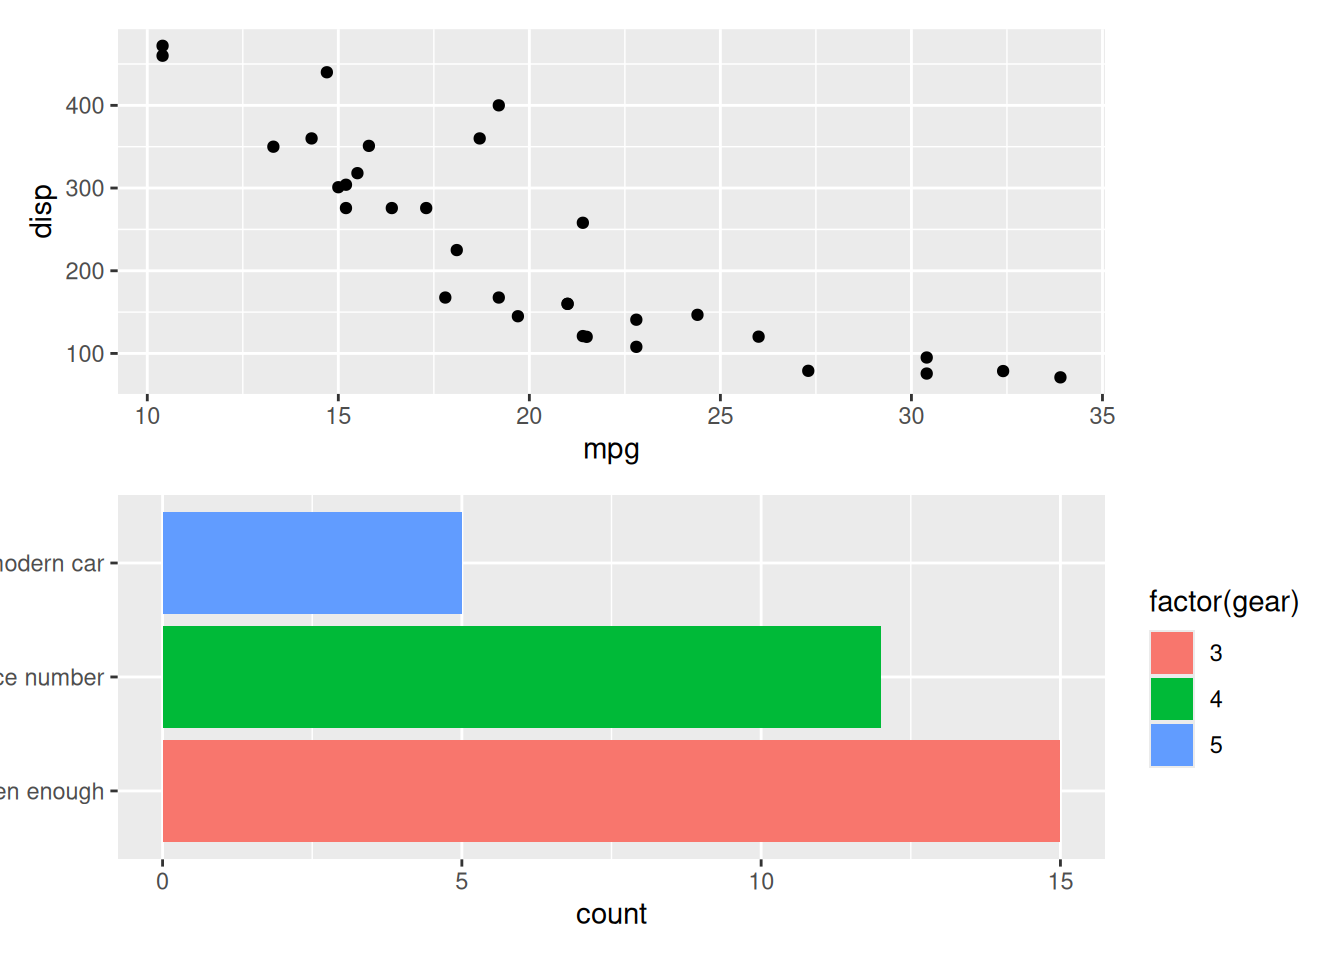
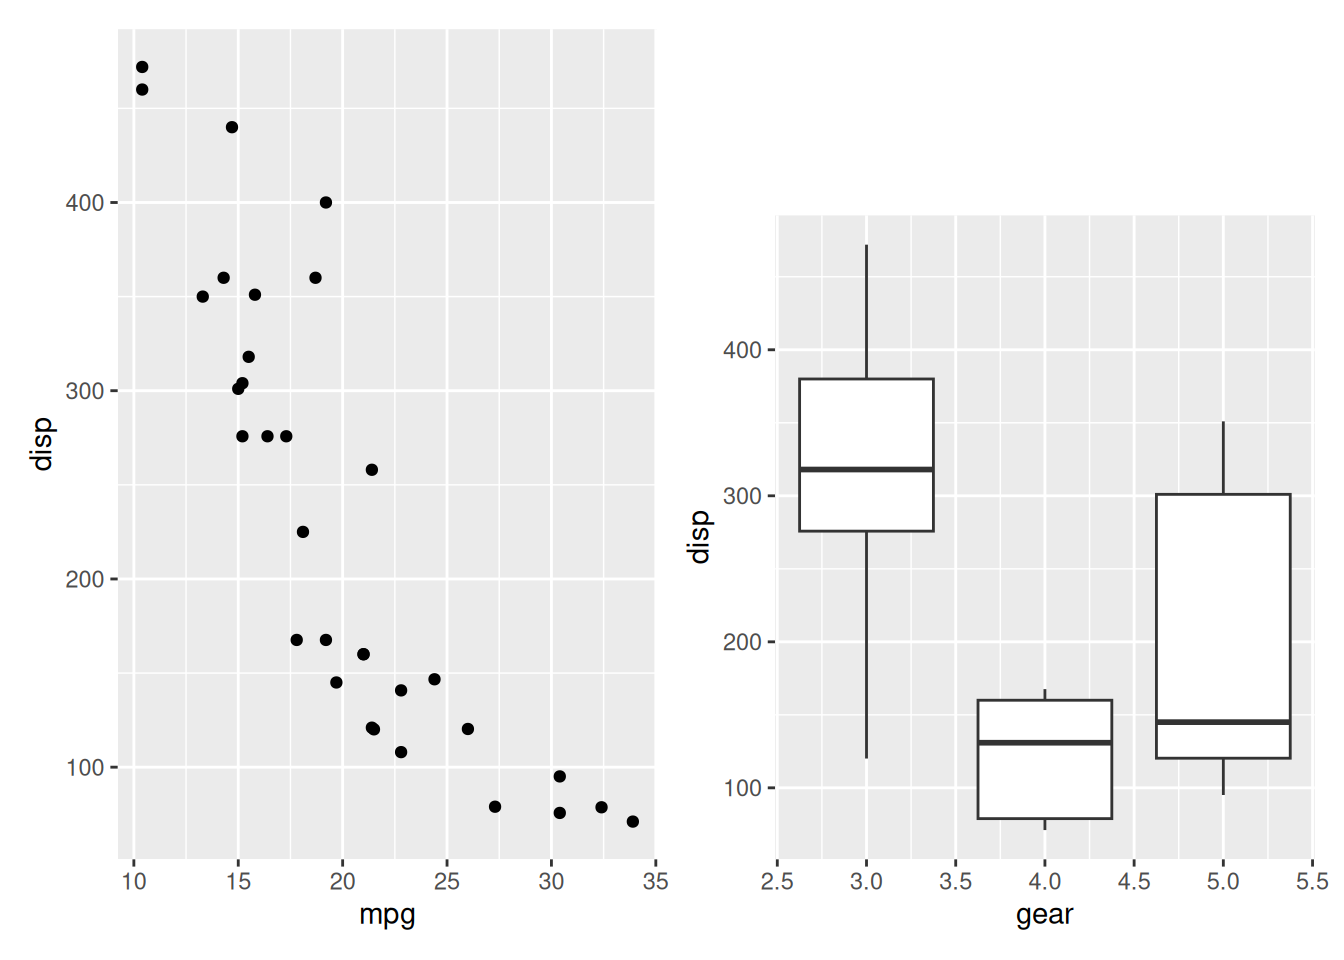
# Partial solution: Free only the left side to maintain right alignmentalign_plots(p_simple, free_align(p_wide_labels, axes ="l"), ncol =1L)
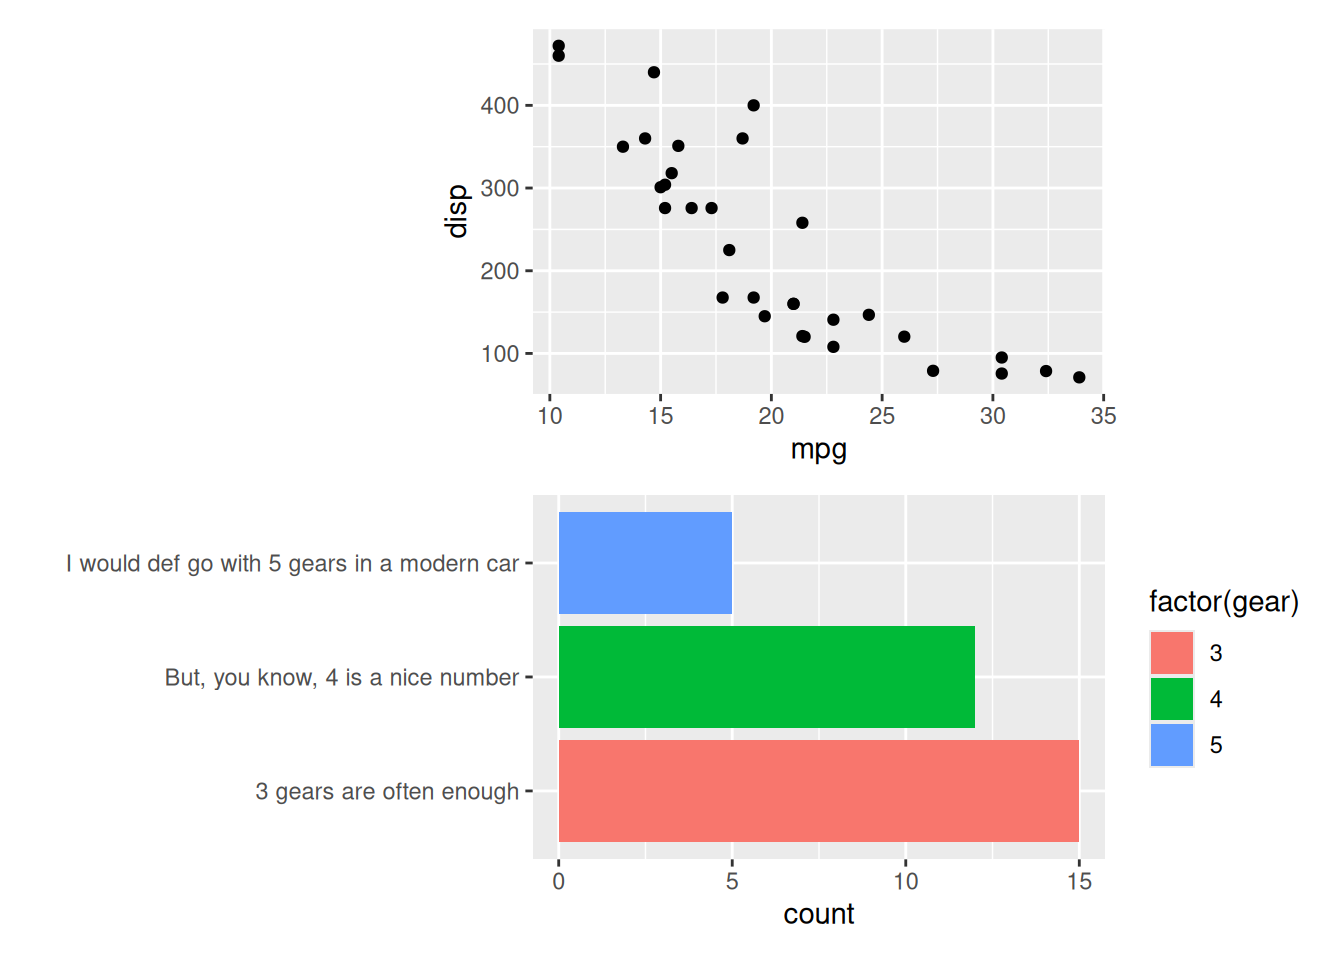
4.3free_space() - Space Constraint Removal
free_space() removes the allocated space for plot elements when aligning. This is particularly useful for removing padding introduced by long axis labels or titles.
While it may not appear impactful on its own, free_space() is often essential when used together with free_border().
4.4free_border()
free_border() attaches borders (e.g., axis titles, tick marks) directly to the plot panel. This keeps them visually close to the panel during alignment.
However, free_border() does not remove the space these components occupy. This means that, although the border (e.g., axis title) follows the plot panel more tightly in p_simple, the space reserved for it still exists. During alignment, this space is added to p_wide_labels, potentially adding unnecessary spaces.
To fully eliminate the size contribution of the border, we often combine free_border() with free_space():
This removes the reserved size on the left side (spaces = “l”), ensuring clean, panel-based alignment without extra padding.
4.5free_lab()
free_lab() is similar to free_border(), but only attaches axis titles and tick labels, not full borders. It’s mainly included for completeness; in most cases, combining free_border() and free_space() is sufficient.
4.6free_vp()
The free_vp() function allows you to customize the grid viewport when aligning plots, giving you precise control over plot positioning and sizing. This is useful for precisely placing plots when alignment alone is insufficient.